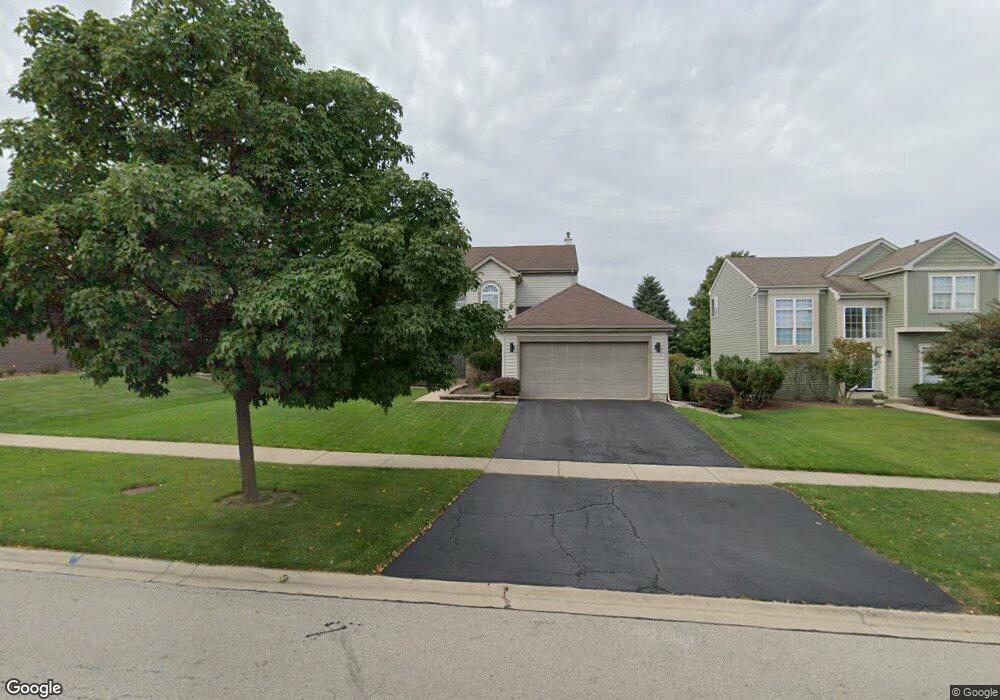
126 Westridge Blvd Bartlett, IL 60103
Estimated Value: $448,000 - $473,000
3
Beds
3
Baths
1,772
Sq Ft
$260/Sq Ft
Est. Value
About This Home
This home is located at 126 Westridge Blvd, Bartlett, IL 60103 and is currently estimated at $460,760, approximately $260 per square foot. 126 Westridge Blvd is a home located in Cook County with nearby schools including Nature Ridge Elementary School, Kenyon Woods Middle School, and South Elgin High School.
Ownership History
Date
Name
Owned For
Owner Type
Purchase Details
Closed on
Dec 30, 2002
Sold by
Yachinich James D and Yachinich Deborah A
Bought by
Aluquin Jonel D and Aluquin Maria Cecilia T
Current Estimated Value
Home Financials for this Owner
Home Financials are based on the most recent Mortgage that was taken out on this home.
Original Mortgage
$254,700
Interest Rate
6.06%
Purchase Details
Closed on
Dec 1, 1995
Sold by
Centex Real Estate Corp
Bought by
Yachinich James D and Yachinich Deborah A
Home Financials for this Owner
Home Financials are based on the most recent Mortgage that was taken out on this home.
Original Mortgage
$150,682
Interest Rate
7.43%
Purchase Details
Closed on
Jun 27, 1995
Sold by
Mineral & Land Resources Corp
Bought by
Centex Real Estate Corp
Create a Home Valuation Report for This Property
The Home Valuation Report is an in-depth analysis detailing your home's value as well as a comparison with similar homes in the area
Home Values in the Area
Average Home Value in this Area
Purchase History
| Date | Buyer | Sale Price | Title Company |
|---|---|---|---|
| Aluquin Jonel D | $283,000 | Agtf Inc | |
| Yachinich James D | $177,500 | -- | |
| Centex Real Estate Corp | -- | -- |
Source: Public Records
Mortgage History
| Date | Status | Borrower | Loan Amount |
|---|---|---|---|
| Previous Owner | Aluquin Jonel D | $254,700 | |
| Previous Owner | Yachinich James D | $150,682 |
Source: Public Records
Tax History Compared to Growth
Tax History
| Year | Tax Paid | Tax Assessment Tax Assessment Total Assessment is a certain percentage of the fair market value that is determined by local assessors to be the total taxable value of land and additions on the property. | Land | Improvement |
|---|---|---|---|---|
| 2024 | $10,314 | $32,000 | $8,415 | $23,585 |
| 2023 | $9,975 | $32,000 | $8,415 | $23,585 |
| 2022 | $9,975 | $32,000 | $8,415 | $23,585 |
| 2021 | $9,317 | $24,519 | $7,425 | $17,094 |
| 2020 | $9,179 | $24,519 | $7,425 | $17,094 |
| 2019 | $9,095 | $27,244 | $7,425 | $19,819 |
| 2018 | $9,799 | $26,896 | $6,435 | $20,461 |
| 2017 | $9,628 | $26,896 | $6,435 | $20,461 |
| 2016 | $8,992 | $26,896 | $6,435 | $20,461 |
| 2015 | $8,414 | $23,228 | $5,692 | $17,536 |
| 2014 | $8,302 | $23,228 | $5,692 | $17,536 |
| 2013 | $7,975 | $23,228 | $5,692 | $17,536 |
Source: Public Records
Map
Nearby Homes
- 227 Faircroft Rd Unit 1
- 240 Hearthstone Dr
- 180 Primrose Ln Unit 1
- 184 Primrose Ln Unit 1
- 1969 Osprey Ct Unit 223
- 186 Sunflower Ln
- 1016 Moraine Dr
- 1079 Atterberg Rd
- 200 Patrick Dr
- 1101 Mable Ln Unit 1101
- 1458 Deer Pointe Dr
- 303 Ann St
- 300 N South Elgin Blvd
- 2376 Southwind Blvd
- 1066 Moraine Dr
- 1052 Moraine Dr
- 1071 Moraine Dr
- 561 South Dr
- 653 Elgin Ave
- 767 Dixon Ave
- 122 Westridge Blvd
- 130 Westridge Blvd Unit 1
- 134 Westridge Blvd
- 118 Westridge Blvd
- 133 Hearthstone Dr
- 137 Hearthstone Dr
- 129 Hearthstone Dr
- 141 Hearthstone Dr
- 114 Westridge Blvd
- 131 Westridge Blvd
- 123 Westridge Blvd
- 145 Hearthstone Dr Unit 1
- 135 Westridge Blvd
- 119 Westridge Blvd
- 142 Westridge Blvd
- 110 Westridge Blvd
- 149 Hearthstone Dr Unit 1
- 121 Hearthstone Dr
- 139 Westridge Blvd
- 2077 Providence Dr