


1260 Cravens Ln Unit 2 Carpinteria, CA 93013
Santa Monica-El Carro NeighborhoodHighlights
- Popular Property
- Updated Kitchen
- Reverse Osmosis System
- Property is near an ocean
- Peek-A-Boo Views
- Property is near park, public transit, schools, shops, and bus stop
About This Home
Discover Coastal Elegance in the Villas of Carpinteria a Planned Unit Development.
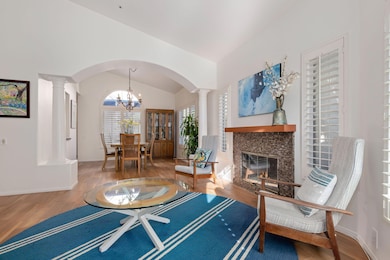
Nestled within the coveted Villas of Carpinteria, this turn-key single-level residence perfectly embodies the relaxed sophistication of coastal living. Thoughtfully renovated throughout, the home features vaulted ceilings, stunning porcelain tile flooring, and custom cabinetry--every detail designed for comfort and style.
The light-filled floor plan offers a gracious living room with a gas fireplace, a formal dining area, and an expansive kitchen with a charming breakfast nook. Two spacious ensuite bedrooms, walk-in closets, and a dedicated laundry room enhance everyday convenience. An attached two-car garage provides direct interior access. Step outside to your private rear patio, beautifully finished with flagstone walkways, ideal for outdoor dining and entertaining.
Set in an upscale community near the foothills, residents enjoy a relaxed lifestyle with access to a private pool and spaall just minutes from downtown Carpinteria, world-class beaches, and scenic hiking trails.
Whether you're seeking a serene full-time residence or a charming coastal getaway, this is a rare and delightful gem in an unbeatable location.

Property Details
Home Type
- Multi-Family
Year Built
- Built in 1990
Lot Details
- 2,178 Sq Ft Lot
- Interior Lot
- Level Lot
- Property is in excellent condition
HOA Fees
- $707 Monthly HOA Fees
Parking
- 2 Car Direct Access Garage
- Guest Parking
Property Views
- Peek-A-Boo
- Mountain
Home Design
- Mediterranean Architecture
- Property Attached
- Slab Foundation
- Tile Roof
- Stucco
Interior Spaces
- 1,352 Sq Ft Home
- 1-Story Property
- Vaulted Ceiling
- Ceiling Fan
- Skylights
- Gas Fireplace
- Double Pane Windows
- Plantation Shutters
- Living Room with Fireplace
- Dining Area
- Tile Flooring
Kitchen
- Updated Kitchen
- Breakfast Area or Nook
- Double Oven
- Built-In Gas Oven
- Built-In Electric Range
- Dishwasher
- Disposal
- Reverse Osmosis System
Bedrooms and Bathrooms
- 2 Bedrooms
- Remodeled Bathroom
- 2 Full Bathrooms
Laundry
- Laundry Room
- Dryer
- Washer
- 220 Volts In Laundry
Home Security
- Home Security System
- Fire and Smoke Detector
- Fire Sprinkler System
Outdoor Features
- Property is near an ocean
- Enclosed Patio or Porch
Location
- Property is near park, public transit, schools, shops, and bus stop
- City Lot
Schools
- Aliso Elementary School
- Carp. Jr. Middle School
- Carp. Sr. High School
Utilities
- Cooling Available
- Forced Air Heating System
- Vented Exhaust Fan
- Underground Utilities
- Water Softener is Owned
- Cable TV Available
Listing and Financial Details
- Assessor Parcel Number 004-014-014
- Seller Considering Concessions
Community Details
Overview
- Association fees include insurance, prop mgmt, comm area maint, exterior maint
- 30 Buildings
- 30 Units
- Villas Of Carpinteri Community
- Greenbelt
- Planned Unit Development
Recreation
- Community Pool
- Community Spa
Pet Policy
- Pets Allowed
Map
Home Values in the Area
Average Home Value in this Area
Tax History
| Year | Tax Paid | Tax Assessment Tax Assessment Total Assessment is a certain percentage of the fair market value that is determined by local assessors to be the total taxable value of land and additions on the property. | Land | Improvement |
|---|---|---|---|---|
| 2025 | $5,236 | $428,836 | $155,367 | $273,469 |
| 2023 | $5,236 | $412,185 | $149,335 | $262,850 |
| 2022 | $5,020 | $404,104 | $146,407 | $257,697 |
| 2021 | $4,905 | $396,182 | $143,537 | $252,645 |
| 2020 | $4,834 | $392,121 | $142,066 | $250,055 |
| 2019 | $4,726 | $384,433 | $139,281 | $245,152 |
| 2018 | $4,635 | $376,896 | $136,550 | $240,346 |
| 2017 | $4,540 | $369,507 | $133,873 | $235,634 |
| 2016 | $4,460 | $362,263 | $131,249 | $231,014 |
| 2015 | $4,416 | $356,822 | $129,278 | $227,544 |
| 2014 | $6,425 | $564,198 | $282,099 | $282,099 |
Property History
| Date | Event | Price | List to Sale | Price per Sq Ft |
|---|---|---|---|---|
| 02/24/2026 02/24/26 | Price Changed | $1,198,000 | -4.2% | $886 / Sq Ft |
| 11/08/2025 11/08/25 | For Sale | $1,250,000 | -- | $925 / Sq Ft |
Purchase History
| Date | Type | Sale Price | Title Company |
|---|---|---|---|
| Interfamily Deed Transfer | -- | None Available | |
| Grant Deed | $635,000 | Chicago Title Company | |
| Interfamily Deed Transfer | -- | None Available | |
| Interfamily Deed Transfer | -- | None Available | |
| Interfamily Deed Transfer | -- | None Available | |
| Grant Deed | -- | Chicago Title Co |
Mortgage History
| Date | Status | Loan Amount | Loan Type |
|---|---|---|---|
| Open | $365,000 | New Conventional | |
| Previous Owner | $292,000 | No Value Available |
Source: Santa Barbara Multiple Listing Service
MLS Number: 25-4103
APN: 004-014-014
Disclaimer: Certain information contained herein is derived from information provided by parties other than Homes.com. All information provided is deemed reliable, but is not guaranteed to be accurate and should be independently verified.
![]() This information is being provided for your personal, non-commercial use and may not be used for any purpose other than to identify prospective properties that you may be interested in purchasing. Data relating to real estate for sale on this Website comes from the Internet Data Exchange Program of the Santa Barbara Multiple Listing Service. All information is deemed reliable, but not guaranteed. All properties are subject to prior sale, change or withdrawal. Neither the Santa Barbara Multiple Listing Service nor the listing broker(s) shall be responsible for any typographical errors, misinformation, or misprints.
This information is being provided for your personal, non-commercial use and may not be used for any purpose other than to identify prospective properties that you may be interested in purchasing. Data relating to real estate for sale on this Website comes from the Internet Data Exchange Program of the Santa Barbara Multiple Listing Service. All information is deemed reliable, but not guaranteed. All properties are subject to prior sale, change or withdrawal. Neither the Santa Barbara Multiple Listing Service nor the listing broker(s) shall be responsible for any typographical errors, misinformation, or misprints.
Copyright 2026 Santa Barbara Multiple Listing Service. All rights reserved.
- 1255 Franciscan Ct Unit 1
- 3950 Via Real Unit Spc 239
- 3950 Via Real Unit Spc 24
- 1230 Franciscan Ct Unit 7
- 4264 Carpinteria Ave Unit 5
- 4420 Catlin Cir Unit C
- 3735 Santa Claus Ln
- 571 Sand Point Rd
- 910 Pear St
- 4501 Carpinteria Ave Unit C
- 1915 Monte Alegre
- 3595 Padaro Ln
- 3581 Padaro Ln
- 349 Ash Ave Unit Spc 17
- 349 Ash Ave Unit 45
- 4677 Carpinteria Ave Unit P
- 1994 Paquita Dr
- 4731 4th St
- 4700 Sandyland Rd Unit 23
- 3519 Padaro Ln
- 4035 Green Heron Springs Rd
- 635 Sand Point Rd
- 539 Sand Point Rd
- 4499 Del Mar Ave
- 3599 Padaro Ln
- 160 Ash Ave Unit 7
- 000 Padaro
- 4831 Dorrance Way Unit B
- 4858 5th St
- 4822 8th St Unit B&D
- 4880 Sandyland Rd Unit 27
- 4885 Sandyland Rd Unit 2
- 4975 Sandyland Rd Unit 212
- 4975 Sandyland Rd Unit 103
- 1959 Paquita Dr
- 3479 Padaro Ln
- 5161 6th St
- 1129 Church Ln
- 1069 Casitas Pass Rd
- 3375 Foothill Rd Unit 535
Ask me questions while you tour the home.