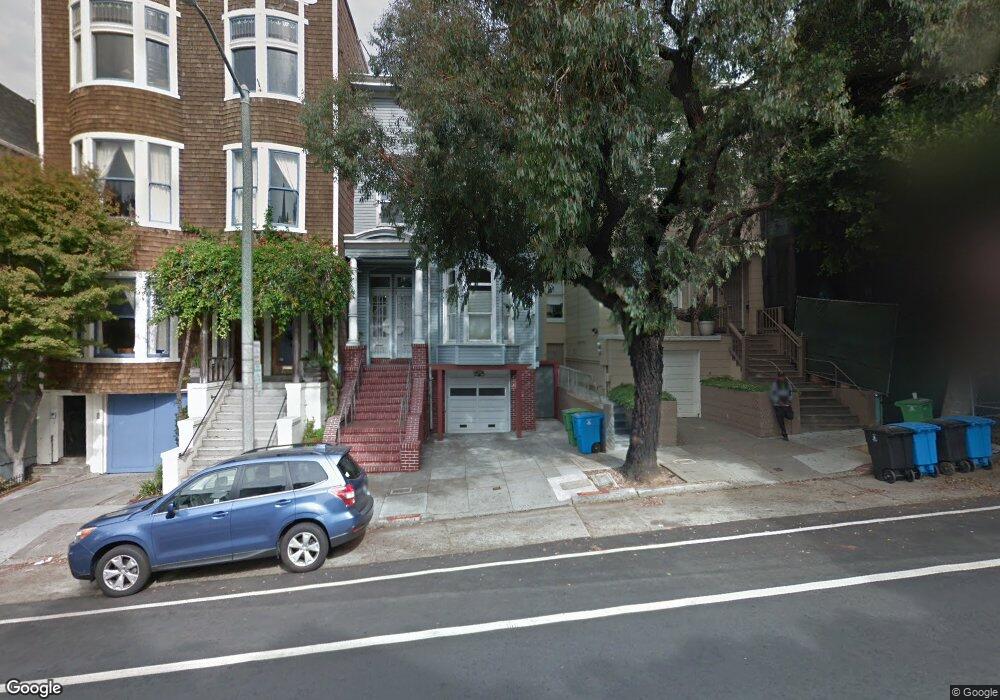
1260 Fulton St Unit 1262 San Francisco, CA 94117
Alamo Square NeighborhoodEstimated Value: $2,235,000 - $3,842,560
6
Beds
5
Baths
3,702
Sq Ft
$741/Sq Ft
Est. Value
About This Home
This home is located at 1260 Fulton St Unit 1262, San Francisco, CA 94117 and is currently estimated at $2,742,140, approximately $740 per square foot. 1260 Fulton St Unit 1262 is a home located in San Francisco County with nearby schools including Muir (John) Elementary School, James Lick Middle School, and Creative Arts Charter School.
Ownership History
Date
Name
Owned For
Owner Type
Purchase Details
Closed on
Oct 28, 2018
Sold by
Nguyen Elizabeth and Pham Hao Q
Bought by
Pham Hoa Q
Current Estimated Value
Purchase Details
Closed on
Jan 28, 2014
Sold by
Pham Hoa Quy
Bought by
Nguyen Elizabeth and Pham Hoa Quy
Purchase Details
Closed on
Sep 26, 2011
Sold by
Pham Hoa Quy and Pham Quy Nhi
Bought by
Pham Hoa Quy
Purchase Details
Closed on
Aug 10, 2010
Sold by
Pham Hoa Quy
Bought by
Pham Quynhi and Pham Hoa Quy
Purchase Details
Closed on
Jan 1, 2009
Sold by
Pham Hoa Quy and Nguyen Joseph K
Bought by
Pham Hoa Quy
Purchase Details
Closed on
Jan 23, 2008
Sold by
Pham Hoa Quy
Bought by
Pham Hoa Quy and Nguyen Joseph K
Purchase Details
Closed on
Jun 28, 2005
Sold by
Lsf Corp
Bought by
Pham Hoa Quy
Home Financials for this Owner
Home Financials are based on the most recent Mortgage that was taken out on this home.
Original Mortgage
$1,000,000
Outstanding Balance
$373,954
Interest Rate
1.37%
Mortgage Type
Commercial
Estimated Equity
$2,368,186
Purchase Details
Closed on
Jun 21, 2005
Sold by
Ghodstinat Soudabeh and Brown Edgerton
Bought by
Lsf Corp
Home Financials for this Owner
Home Financials are based on the most recent Mortgage that was taken out on this home.
Original Mortgage
$1,000,000
Outstanding Balance
$373,954
Interest Rate
1.37%
Mortgage Type
Commercial
Estimated Equity
$2,368,186
Purchase Details
Closed on
Nov 17, 2004
Sold by
Ghodstinat Soudabeh
Bought by
Ghodstinat Soudabeh and Brown Edgerton
Purchase Details
Closed on
Jul 8, 2004
Sold by
Brown Samareh Eskandaripuor
Bought by
Brown Edgerton
Home Financials for this Owner
Home Financials are based on the most recent Mortgage that was taken out on this home.
Original Mortgage
$823,200
Interest Rate
6.5%
Mortgage Type
Commercial
Purchase Details
Closed on
Jul 7, 2004
Sold by
Fleming John A
Bought by
Brown Edgerton
Home Financials for this Owner
Home Financials are based on the most recent Mortgage that was taken out on this home.
Original Mortgage
$823,200
Interest Rate
6.5%
Mortgage Type
Commercial
Purchase Details
Closed on
Jul 17, 1997
Sold by
Fleming John A
Bought by
Fleming John A
Home Financials for this Owner
Home Financials are based on the most recent Mortgage that was taken out on this home.
Original Mortgage
$232,000
Interest Rate
7.7%
Mortgage Type
Commercial
Purchase Details
Closed on
Aug 8, 1995
Sold by
Fleming Earleta L
Bought by
Fleming John A
Purchase Details
Closed on
Feb 16, 1995
Sold by
Fleming Earleta L
Bought by
Fleming Earleta L
Create a Home Valuation Report for This Property
The Home Valuation Report is an in-depth analysis detailing your home's value as well as a comparison with similar homes in the area
Home Values in the Area
Average Home Value in this Area
Purchase History
| Date | Buyer | Sale Price | Title Company |
|---|---|---|---|
| Pham Hoa Q | -- | None Available | |
| Nguyen Elizabeth | -- | None Available | |
| Pham Hoa Quy | -- | None Available | |
| Pham Quynhi | -- | None Available | |
| Pham Hoa Quy | -- | None Available | |
| Pham Hoa Quy | -- | None Available | |
| Pham Hoa Quy | $1,360,000 | Commonwealth Title Company | |
| Lsf Corp | -- | -- | |
| Ghodstinat Soudabeh | -- | -- | |
| Ghodstinat Soudabeh | -- | -- | |
| Brown Edgerton | -- | Chicago Title Company | |
| Brown Edgerton | $1,176,000 | Chicago Title Company | |
| Fleming John A | -- | Placer Title Company | |
| Fleming John A | -- | -- | |
| Fleming Earleta L | -- | -- |
Source: Public Records
Mortgage History
| Date | Status | Borrower | Loan Amount |
|---|---|---|---|
| Open | Pham Hoa Quy | $1,000,000 | |
| Previous Owner | Brown Edgerton | $823,200 | |
| Previous Owner | Fleming John A | $232,000 | |
| Closed | Brown Edgerton | $225,200 |
Source: Public Records
Tax History Compared to Growth
Tax History
| Year | Tax Paid | Tax Assessment Tax Assessment Total Assessment is a certain percentage of the fair market value that is determined by local assessors to be the total taxable value of land and additions on the property. | Land | Improvement |
|---|---|---|---|---|
| 2025 | $24,837 | $2,100,578 | $1,115,112 | $984,038 |
| 2024 | $24,837 | $2,059,819 | $1,093,248 | $964,745 |
| 2023 | $24,471 | $2,019,834 | $1,071,813 | $945,830 |
| 2022 | $24,014 | $1,980,409 | $1,050,798 | $927,287 |
| 2021 | $24,876 | $2,050,384 | $1,098,567 | $951,817 |
| 2020 | $24,990 | $2,026,227 | $1,087,304 | $938,923 |
| 2019 | $24,213 | $1,986,502 | $1,065,985 | $920,517 |
| 2018 | $16,770 | $1,384,990 | $735,035 | $649,955 |
| 2017 | $16,273 | $1,357,860 | $720,623 | $637,237 |
| 2016 | $16,008 | $1,331,263 | $706,494 | $624,769 |
| 2015 | $15,793 | $1,310,127 | $695,882 | $614,245 |
| 2014 | $20,403 | $1,712,580 | $909,671 | $802,909 |
Source: Public Records
Map
Nearby Homes
- 613 Broderick St
- 617 Broderick St Unit B
- 529 Broderick St Unit A
- 516 Baker St Unit 516
- 1733 Turk St Unit 1735
- 350 Broderick St Unit 300
- 1909 Eddy St Unit 3
- 1048-1050 Oak St
- 560 Lyon St
- 726 Lyon St
- 1828 Eddy St Unit 101
- 1057 Steiner St
- 988 Fulton St Unit 132
- 102 Baker St
- 102 Baker St Unit A
- 102 Baker St Unit B
- 102 Baker St Unit C
- 2000 Ellis St Unit 201
- 972 Haight St
- 745 Fillmore St
- 1262 Fulton St
- 1218 Fulton St
- 1266 Fulton St Unit 1270
- 1216 Fulton St
- 1272 Fulton St
- 1214 Fulton St
- 818 Divisadero St Unit A
- 1210 Fulton St Unit 1212
- 820 Divisadero St Unit 824
- 800 Divisadero St
- 1206 Fulton St
- 834 Divisadero St
- 1563 Mcallister St Unit 1563
- 1561 Mcallister St
- 1565 Mcallister St
- 1555 Mcallister St
- 1567 Mcallister St Unit 2
- 1567 Mcallister St Unit 202
- 1567 Mcallister St Unit 201
- 1567 Mcallister St Unit 102