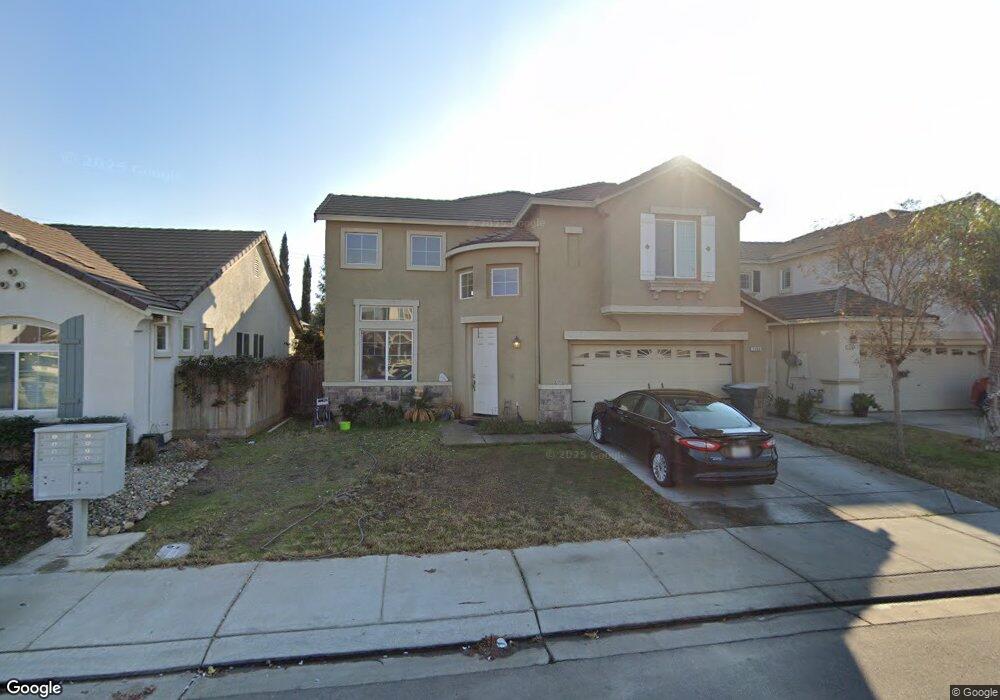
1260 Orion Ct Merced, CA 95348
Estimated Value: $483,000 - $574,000
5
Beds
3
Baths
3,096
Sq Ft
$171/Sq Ft
Est. Value
About This Home
This home is located at 1260 Orion Ct, Merced, CA 95348 and is currently estimated at $530,679, approximately $171 per square foot. 1260 Orion Ct is a home located in Merced County with nearby schools including Franklin Elementary School, Rudolph Rivera Middle School, and El Capitan High School.
Ownership History
Date
Name
Owned For
Owner Type
Purchase Details
Closed on
Jun 28, 2011
Sold by
Federal National Mortgage Association
Bought by
Cherizola John Edward and Nuno Rosangel
Current Estimated Value
Home Financials for this Owner
Home Financials are based on the most recent Mortgage that was taken out on this home.
Original Mortgage
$198,850
Outstanding Balance
$137,061
Interest Rate
4.55%
Mortgage Type
New Conventional
Estimated Equity
$393,618
Purchase Details
Closed on
Jun 3, 2010
Sold by
Singh Sital
Bought by
Federal National Mortgage Association
Purchase Details
Closed on
Jan 2, 2008
Sold by
Kaur Surinder
Bought by
Singh Sital
Home Financials for this Owner
Home Financials are based on the most recent Mortgage that was taken out on this home.
Original Mortgage
$260,125
Interest Rate
6.15%
Mortgage Type
Purchase Money Mortgage
Create a Home Valuation Report for This Property
The Home Valuation Report is an in-depth analysis detailing your home's value as well as a comparison with similar homes in the area
Purchase History
We collect this data history from publicly available records. To have your information removed, we recommend requesting removal directly through your county’s website.
| Date | Buyer | Sale Price | Title Company |
|---|---|---|---|
| Cherizola John Edward | $205,000 | Servicelink | |
| Federal National Mortgage Association | $272,214 | First American Title Ins Co | |
| Singh Sital | -- | Old Republic Title Company | |
| Singh Sital | $325,500 | Old Republic Title Company |
Source: Public Records
Mortgage History
We collect this data history from publicly available records. To have your information removed, we recommend requesting removal directly through your county’s website.
| Date | Status | Borrower | Loan Amount |
|---|---|---|---|
| Open | Cherizola John Edward | $198,850 | |
| Previous Owner | Singh Sital | $260,125 |
Source: Public Records
Tax History
| Year | Tax Paid | Tax Assessment Tax Assessment Total Assessment is a certain percentage of the fair market value that is determined by local assessors to be the total taxable value of land and additions on the property. | Land | Improvement |
|---|---|---|---|---|
| 2025 | $3,884 | $262,628 | $14,085 | $248,543 |
| 2024 | $3,884 | $257,479 | $13,809 | $243,670 |
| 2023 | $3,812 | $252,432 | $13,539 | $238,893 |
| 2022 | $3,721 | $247,483 | $13,274 | $234,209 |
| 2021 | $3,643 | $242,631 | $13,014 | $229,617 |
| 2020 | $3,646 | $240,144 | $12,881 | $227,263 |
| 2019 | $3,584 | $235,436 | $12,629 | $222,807 |
| 2018 | $3,330 | $230,821 | $12,382 | $218,439 |
| 2017 | $3,395 | $226,296 | $12,140 | $214,156 |
| 2016 | $3,330 | $221,859 | $11,902 | $209,957 |
| 2015 | $3,276 | $218,528 | $11,724 | $206,804 |
| 2014 | $3,215 | $214,248 | $11,495 | $202,753 |
Source: Public Records
Map
Nearby Homes
- 1277 Baxter Dr
- 1295 Wildcat Dr
- 3758 Morning Glory Ave
- 1281 Sunup Dr
- 1255 Day Light Dr
- 1321 Jenner Dr
- 3880 Early Light Ave
- 1175 Evening Star Dr
- 1339 Playa Del Rey Dr
- 4043 Wood Creek Ct
- 1478 La Sierra St
- 4089 Bayonet Dr
- 3888 Solstice Ave
- 3622 N State Highway 59
- 4120 Scarlet Ct
- 1525 La Sierra St
- 4096 Toulon Ct
- 4076 St Remy Ct
- 4119 Anise Ct
- 1151 Mazatlan Place
Your Personal Tour Guide
Ask me questions while you tour the home.