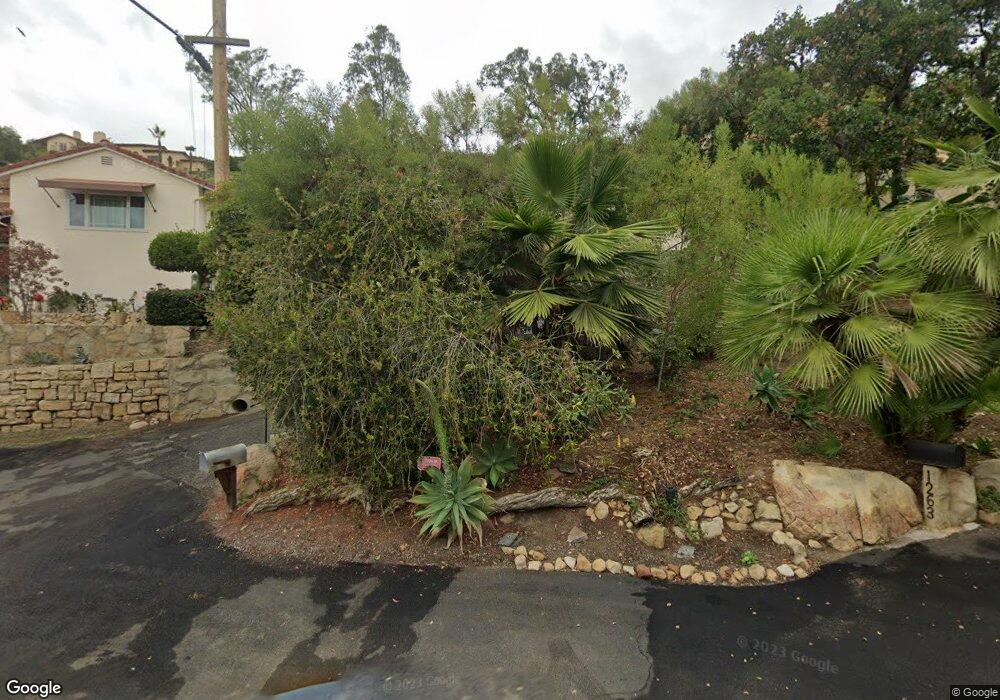
1261 Dover Ln Santa Barbara, CA 93103
Riviera NeighborhoodEstimated Value: $2,257,726 - $3,242,000
3
Beds
2
Baths
1,754
Sq Ft
$1,611/Sq Ft
Est. Value
About This Home
This home is located at 1261 Dover Ln, Santa Barbara, CA 93103 and is currently estimated at $2,826,182, approximately $1,611 per square foot. 1261 Dover Ln is a home located in Santa Barbara County with nearby schools including Roosevelt Elementary School, Santa Barbara Junior High School, and Santa Barbara Senior High School.
Ownership History
Date
Name
Owned For
Owner Type
Purchase Details
Closed on
Jan 31, 2025
Sold by
Thelma May Bowser Trust and Baiocchi Rochelle
Bought by
Rochelle L Baiocchi Revocable Trust and Baiocchi
Current Estimated Value
Purchase Details
Closed on
Nov 6, 2024
Sold by
Thelma May Bowser Trust and Riffero John H
Bought by
Thelma May Bowser Trust and Baiocchi
Purchase Details
Closed on
Dec 12, 2013
Sold by
Bowser Rose Anne and Riffero John H
Bought by
Bowser Rose Anne and Rifferi John H
Purchase Details
Closed on
Oct 4, 2013
Sold by
Bowser Rose Anne
Bought by
Riffero John H and Kang Yun Hui
Purchase Details
Closed on
Jul 6, 2011
Sold by
Bowser Rose Anne
Bought by
Bowser Rose Anne
Purchase Details
Closed on
Jun 22, 2005
Sold by
Tate Thelma Bowser
Bought by
Bowser Rose Anne
Create a Home Valuation Report for This Property
The Home Valuation Report is an in-depth analysis detailing your home's value as well as a comparison with similar homes in the area
Home Values in the Area
Average Home Value in this Area
Purchase History
| Date | Buyer | Sale Price | Title Company |
|---|---|---|---|
| Rochelle L Baiocchi Revocable Trust | -- | None Listed On Document | |
| Thelma May Bowser Trust | -- | None Listed On Document | |
| Thelma May Bowser Trust | $73,500 | None Listed On Document | |
| Thelma May Bowser Trust | -- | None Listed On Document | |
| Bowser Rose Anne | -- | None Available | |
| Riffero John H | -- | None Available | |
| Bowser Rose Anne | -- | None Available | |
| Bowser Rose Anne | -- | -- |
Source: Public Records
Tax History
| Year | Tax Paid | Tax Assessment Tax Assessment Total Assessment is a certain percentage of the fair market value that is determined by local assessors to be the total taxable value of land and additions on the property. | Land | Improvement |
|---|---|---|---|---|
| 2025 | $1,750 | $1,330,439 | $832,775 | $497,664 |
| 2023 | $1,750 | $148,802 | $53,812 | $94,990 |
| 2022 | $1,683 | $145,885 | $52,757 | $93,128 |
| 2021 | $1,641 | $143,025 | $51,723 | $91,302 |
| 2020 | $1,623 | $141,559 | $51,193 | $90,366 |
| 2019 | $1,594 | $138,785 | $50,190 | $88,595 |
| 2018 | $1,570 | $136,064 | $49,206 | $86,858 |
| 2017 | $1,518 | $133,397 | $48,242 | $85,155 |
| 2016 | $1,567 | $130,783 | $47,297 | $83,486 |
| 2014 | $1,527 | $126,297 | $45,675 | $80,622 |
Source: Public Records
Map
Nearby Homes
- 712 Arbolado Rd
- 1145 Alameda Padre Serra
- 1022 Garcia Rd
- 1512 Hillcrest Rd
- 857 Ferrelo Place
- 849 Alameda Padre Serra
- 1131 Las Alturas Rd Unit Share A
- 1131 Las Alturas Rd Unit Share B
- 1037 Las Alturas Rd
- 1710 Mira Vista Ave
- 1720 Mission Ridge Rd
- 930 Philinda Ave
- 1816 E Las Tunas Rd
- 1246 Diana Ln
- 1107 E Cota St
- 1111 E Cota St
- 535 Alameda Padre Serra
- 1322 E Cota St
- 1012 Alphonse St
- 210 Las Alturas Rd
- 1259 Dover Ln
- 1263 Dover Ln
- 1257 Dover Ln
- 1251 Viscaino Rd
- 1036 Arbolado Rd
- 1270 Dover Ln
- 1255 Dover Ln
- 1229 Viscaino Rd
- 1278 Dover Ln
- 1262 Dover Ln
- 1042 Arbolado Rd
- 1108 Arbolado Rd
- 1253 Dover Hill Rd
- 1253 Dover Ln
- 1260 Dover Ln
- 1030 Arbolado Rd
- 1054 Arbolado Rd
- 1112 Arbolado Rd
- 1237 Viscaino Rd
- 1250 Viscaino Rd
Your Personal Tour Guide
Ask me questions while you tour the home.