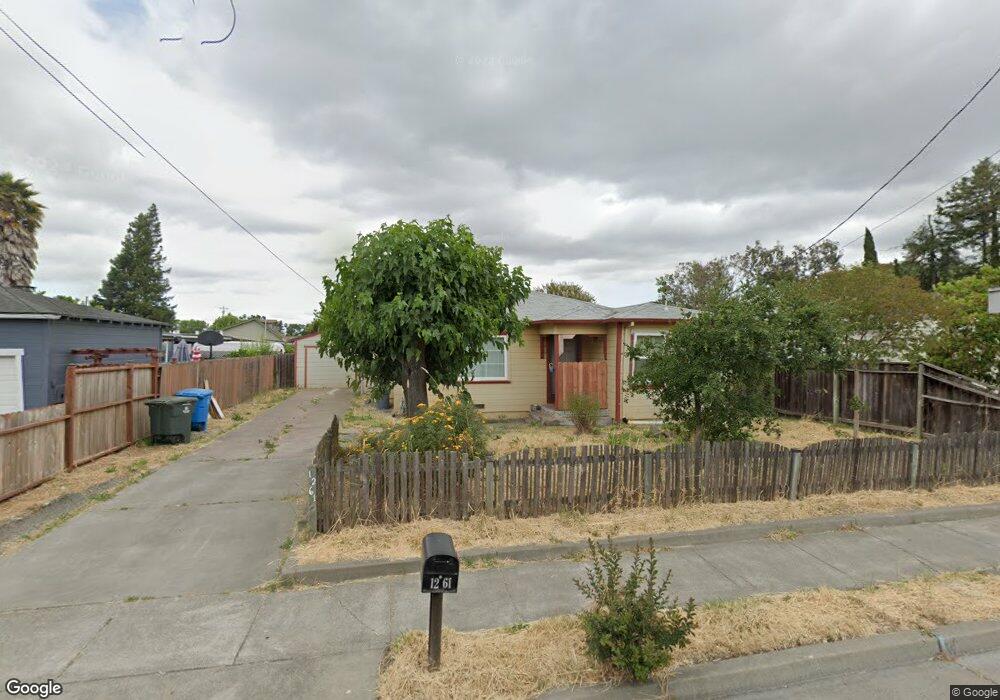
1261 Hearn Ave Santa Rosa, CA 95407
Estimated Value: $547,000 - $665,000
2
Beds
1
Bath
1,081
Sq Ft
$556/Sq Ft
Est. Value
About This Home
This home is located at 1261 Hearn Ave, Santa Rosa, CA 95407 and is currently estimated at $600,793, approximately $555 per square foot. 1261 Hearn Ave is a home located in Sonoma County with nearby schools including Elsie Allen High School and St. Michael's Orthodox School.
Ownership History
Date
Name
Owned For
Owner Type
Purchase Details
Closed on
Aug 12, 2024
Sold by
Rollans Richard K and Rollans Debra L
Bought by
Rollans Family Revocable Trust and Rollans
Current Estimated Value
Purchase Details
Closed on
Jun 11, 2012
Sold by
Ferrera Jason B and Mallie Sophia
Bought by
Rollans Richard K and Rollans Debra L
Home Financials for this Owner
Home Financials are based on the most recent Mortgage that was taken out on this home.
Original Mortgage
$116,250
Interest Rate
3.79%
Mortgage Type
New Conventional
Purchase Details
Closed on
Jul 23, 2002
Sold by
Coshow Iris
Bought by
Ferrera Jason B and Mallie Sophia
Home Financials for this Owner
Home Financials are based on the most recent Mortgage that was taken out on this home.
Original Mortgage
$234,000
Interest Rate
6.7%
Purchase Details
Closed on
Jul 1, 1998
Sold by
Coshow Timothy
Bought by
Coshow Iris
Create a Home Valuation Report for This Property
The Home Valuation Report is an in-depth analysis detailing your home's value as well as a comparison with similar homes in the area
Home Values in the Area
Average Home Value in this Area
Purchase History
| Date | Buyer | Sale Price | Title Company |
|---|---|---|---|
| Rollans Family Revocable Trust | -- | None Listed On Document | |
| Rollans Richard K | -- | None Listed On Document | |
| Rollans Richard K | $155,000 | Fidelity National Title Co | |
| Ferrera Jason B | $260,000 | Old Republic Title Company | |
| Coshow Iris | -- | -- |
Source: Public Records
Mortgage History
| Date | Status | Borrower | Loan Amount |
|---|---|---|---|
| Previous Owner | Rollans Richard K | $116,250 | |
| Previous Owner | Ferrera Jason B | $234,000 |
Source: Public Records
Tax History Compared to Growth
Tax History
| Year | Tax Paid | Tax Assessment Tax Assessment Total Assessment is a certain percentage of the fair market value that is determined by local assessors to be the total taxable value of land and additions on the property. | Land | Improvement |
|---|---|---|---|---|
| 2025 | $3,306 | $194,675 | $77,868 | $116,807 |
| 2024 | $3,306 | $190,859 | $76,342 | $114,517 |
| 2023 | $3,306 | $187,118 | $74,846 | $112,272 |
| 2022 | $3,420 | $183,450 | $73,379 | $110,071 |
| 2021 | $3,164 | $179,854 | $71,941 | $107,913 |
| 2020 | $2,999 | $178,011 | $71,204 | $106,807 |
| 2019 | $2,977 | $174,521 | $69,808 | $104,713 |
| 2018 | $3,071 | $171,100 | $68,440 | $102,660 |
| 2017 | $2,959 | $167,747 | $67,099 | $100,648 |
| 2016 | $2,895 | $164,459 | $65,784 | $98,675 |
| 2015 | -- | $161,989 | $64,796 | $97,193 |
| 2014 | -- | $158,817 | $63,527 | $95,290 |
Source: Public Records
Map
Nearby Homes
- 1260 Aloise Ave
- 2721 Victoria Dr
- 2727 Victoria Dr
- 444 Pueblo Bonito Place
- 1630 Mathwig Dr
- 487 Hearn Ave
- 2632 Wild Bill Way
- 0 West Ave Unit 325019616
- 2154 Corby Ave
- 2630 Arrowhead Dr
- 2599 Silver Spur Dr
- 1953 Alamo Ln
- 1461 Trombetta St
- 1911 Corby Ave
- 1447 Beachwood Dr
- 2323 Calico Ln
- 2002 Marble St
- 1521 Hughes Ave
- 2863 Liscum St
- 101 Colgan Ave Unit 25