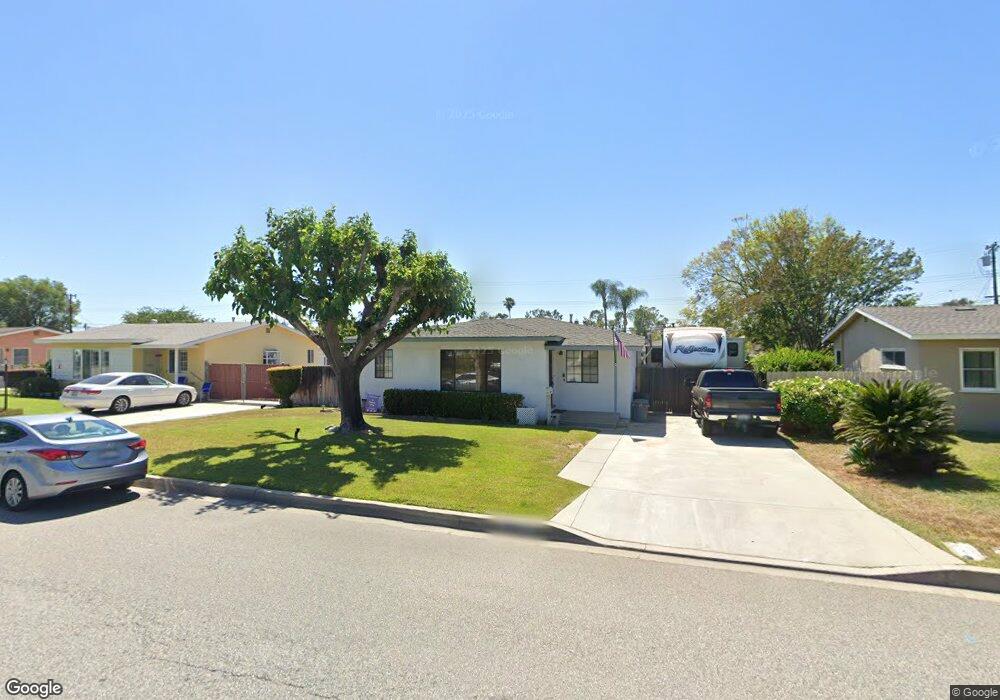
1261 S Bender Ave Glendora, CA 91740
Charter oak NeighborhoodEstimated Value: $708,204 - $809,000
3
Beds
2
Baths
1,094
Sq Ft
$702/Sq Ft
Est. Value
About This Home
This home is located at 1261 S Bender Ave, Glendora, CA 91740 and is currently estimated at $768,301, approximately $702 per square foot. 1261 S Bender Ave is a home located in Los Angeles County with nearby schools including Washington Elementary School, Royal Oak Middle School, and Charter Oak High School.
Ownership History
Date
Name
Owned For
Owner Type
Purchase Details
Closed on
Sep 10, 2019
Sold by
Mehrbrodt Micheal Joseph and Mehrbrodt Jaime Sue
Bought by
Mehrbrodt Michael Joseph and Mehrbrodt Jaime Sue
Current Estimated Value
Purchase Details
Closed on
Sep 13, 2001
Sold by
Rizvi Ali and Rizvi Lorena
Bought by
Mehrbrodt Micheal J
Home Financials for this Owner
Home Financials are based on the most recent Mortgage that was taken out on this home.
Original Mortgage
$212,005
Outstanding Balance
$82,731
Interest Rate
7%
Mortgage Type
FHA
Estimated Equity
$685,570
Purchase Details
Closed on
Aug 10, 1998
Sold by
Glendale Federal Bank Fsb
Bought by
Sukut Development Inc
Purchase Details
Closed on
May 9, 1995
Sold by
Newsome Gary Lester
Bought by
Rizvi Ali
Home Financials for this Owner
Home Financials are based on the most recent Mortgage that was taken out on this home.
Original Mortgage
$145,607
Interest Rate
8.37%
Mortgage Type
FHA
Create a Home Valuation Report for This Property
The Home Valuation Report is an in-depth analysis detailing your home's value as well as a comparison with similar homes in the area
Home Values in the Area
Average Home Value in this Area
Purchase History
| Date | Buyer | Sale Price | Title Company |
|---|---|---|---|
| Mehrbrodt Michael Joseph | -- | None Available | |
| Mehrbrodt Micheal J | $215,000 | North American Title Co | |
| Sukut Development Inc | $148,000 | Fidelity Title | |
| Rizvi Ali | $148,000 | First American Title Company |
Source: Public Records
Mortgage History
| Date | Status | Borrower | Loan Amount |
|---|---|---|---|
| Open | Mehrbrodt Micheal J | $212,005 | |
| Previous Owner | Rizvi Ali | $145,607 |
Source: Public Records
Tax History Compared to Growth
Tax History
| Year | Tax Paid | Tax Assessment Tax Assessment Total Assessment is a certain percentage of the fair market value that is determined by local assessors to be the total taxable value of land and additions on the property. | Land | Improvement |
|---|---|---|---|---|
| 2025 | $3,974 | $317,595 | $215,969 | $101,626 |
| 2024 | $3,974 | $311,369 | $211,735 | $99,634 |
| 2023 | $3,879 | $305,265 | $207,584 | $97,681 |
| 2022 | $3,828 | $299,280 | $203,514 | $95,766 |
| 2021 | $3,769 | $293,413 | $199,524 | $93,889 |
| 2019 | $3,686 | $284,712 | $193,607 | $91,105 |
| 2018 | $3,471 | $279,130 | $189,811 | $89,319 |
| 2016 | $3,315 | $268,293 | $182,442 | $85,851 |
| 2015 | $3,300 | $264,264 | $179,702 | $84,562 |
| 2014 | $3,297 | $259,088 | $176,182 | $82,906 |
Source: Public Records
Map
Nearby Homes
- 644 W Gaillard St
- 1223 Charvers Ave
- 330 W Payson St
- 1401 S Grand Ave
- 1030 S Danehurst Ave
- 125 W Ronwood St
- 149 Rosalynn Dr
- 755 W Citrus Edge St
- 950 Forestdale Ave
- 1065 S Prospero Dr
- 946 S Glendora Ave
- 205 W Linfield St
- 352 Temmera Ln
- 1700 S Glendora Ave Unit 40
- 1700 S Glendora Ave Unit 43
- 833 S Vecino Dr
- 1760 S Vecino Ave
- 1630 S Barranca Ave Unit 103
- 1630 S Barranca Ave Unit 39
- 1630 S Barranca Ave
- 1251 S Bender Ave
- 1271 S Bender Ave
- 1260 S Westridge Ave
- 1241 S Bender Ave
- 1281 S Bender Ave
- 1268 S Westridge Ave
- 1250 S Westridge Ave
- 1272 S Westridge Ave
- 1260 S Bender Ave
- 1270 S Bender Ave
- 1236 S Westridge Ave
- 1250 S Bender Ave
- 1231 S Bender Ave
- 1301 S Bender Ave
- 1306 S Westridge Ave
- 1280 S Bender Ave
- 1240 S Bender Ave
- 1232 S Westridge Ave
- 1310 S Westridge Ave
- 1300 S Bender Ave