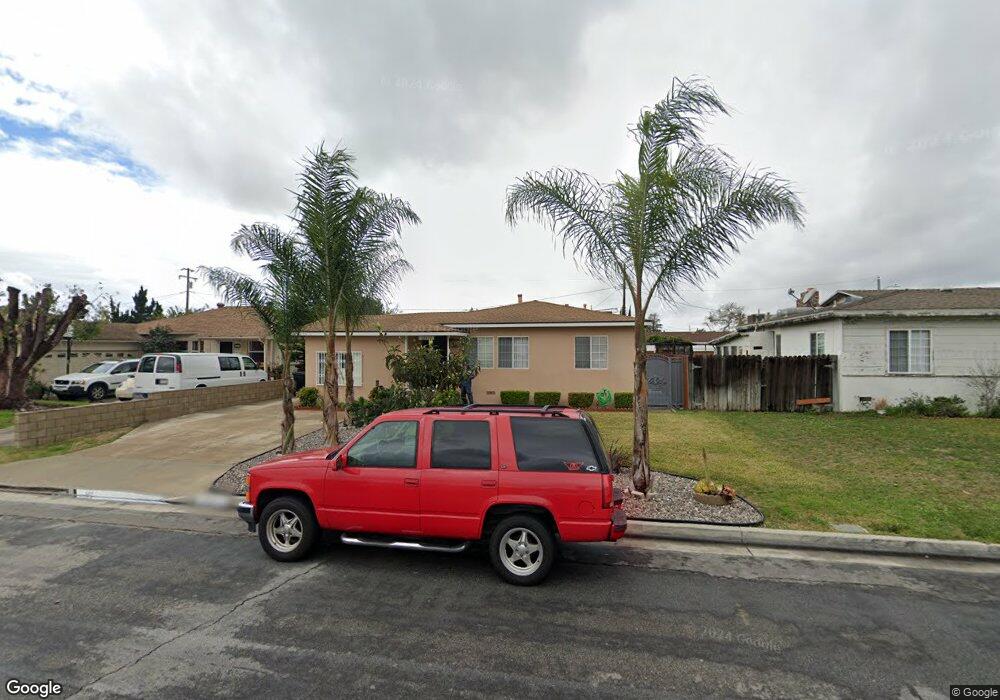
12611 Glen St Garden Grove, CA 92840
Estimated Value: $1,021,000 - $1,178,000
3
Beds
2
Baths
1,880
Sq Ft
$585/Sq Ft
Est. Value
About This Home
This home is located at 12611 Glen St, Garden Grove, CA 92840 and is currently estimated at $1,100,347, approximately $585 per square foot. 12611 Glen St is a home located in Orange County with nearby schools including Crosby Elementary School, Izaak Walton Intermediate School, and Garden Grove High School.
Ownership History
Date
Name
Owned For
Owner Type
Purchase Details
Closed on
Jul 1, 2005
Sold by
Rhee Yun
Bought by
Rhee Yun and Yun Rhee Revocable Living Trust
Current Estimated Value
Purchase Details
Closed on
May 5, 1998
Sold by
John Sohl and John Debra
Bought by
Rhee Yun
Home Financials for this Owner
Home Financials are based on the most recent Mortgage that was taken out on this home.
Original Mortgage
$136,000
Interest Rate
7.17%
Purchase Details
Closed on
May 31, 1994
Sold by
Long Dariene D
Bought by
Sohl John and Sohl Debra
Home Financials for this Owner
Home Financials are based on the most recent Mortgage that was taken out on this home.
Original Mortgage
$151,023
Interest Rate
8.83%
Mortgage Type
FHA
Purchase Details
Closed on
Feb 10, 1994
Sold by
Sbs Trust Deed Network
Bought by
Long Dariene D
Create a Home Valuation Report for This Property
The Home Valuation Report is an in-depth analysis detailing your home's value as well as a comparison with similar homes in the area
Home Values in the Area
Average Home Value in this Area
Purchase History
| Date | Buyer | Sale Price | Title Company |
|---|---|---|---|
| Rhee Yun | -- | -- | |
| Rhee Yun | $170,000 | First American Title Ins Co | |
| Sohl John | $154,000 | Orange Coast Title Company | |
| Long Dariene D | $188,471 | Orange Coast Title Of La |
Source: Public Records
Mortgage History
| Date | Status | Borrower | Loan Amount |
|---|---|---|---|
| Closed | Rhee Yun | $136,000 | |
| Previous Owner | Sohl John | $151,023 |
Source: Public Records
Tax History Compared to Growth
Tax History
| Year | Tax Paid | Tax Assessment Tax Assessment Total Assessment is a certain percentage of the fair market value that is determined by local assessors to be the total taxable value of land and additions on the property. | Land | Improvement |
|---|---|---|---|---|
| 2025 | $4,240 | $333,970 | $197,092 | $136,878 |
| 2024 | $4,240 | $327,422 | $193,227 | $134,195 |
| 2023 | $4,159 | $321,002 | $189,438 | $131,564 |
| 2022 | $4,065 | $314,708 | $185,723 | $128,985 |
| 2021 | $4,007 | $308,538 | $182,082 | $126,456 |
| 2020 | $3,959 | $305,375 | $180,215 | $125,160 |
| 2019 | $3,905 | $299,388 | $176,682 | $122,706 |
| 2018 | $3,810 | $293,518 | $173,218 | $120,300 |
| 2017 | $3,769 | $287,763 | $169,821 | $117,942 |
| 2016 | $3,583 | $282,121 | $166,491 | $115,630 |
| 2015 | $3,535 | $277,884 | $163,990 | $113,894 |
| 2014 | $3,452 | $272,441 | $160,778 | $111,663 |
Source: Public Records
Map
Nearby Homes
- 12662 Woodland Ln
- 12851 Newhope St
- 12727 West St
- 12861 West St Unit 157
- 12861 West St Unit 100
- 12970 Newhope St
- 11841 Shetland Rd
- 13052 Rockinghorse Rd
- 12222 Emrys Ave
- 12246 Nadine Cir
- 405 13181 Lampson
- 11731 Rose Dr
- 11081 Iris Dr
- 12600 Euclid St Unit 19
- 11052 Peppertree Ln
- 11102 Avolencia Place
- 11252 Chapman Ave
- 12332 Euclid St
- 12555 Euclid St Unit 61
- 12555 Euclid St Unit 2
- 12621 Glen St
- 12601 Glen St
- 12631 Glen St
- 12612 George St
- 12622 George St
- 12602 George St
- 12641 Glen St
- 12632 George St
- 12612 Glen St
- 12622 Glen St
- 12602 Glen St
- 11691 Chester Ave
- 11711 Chester Ave
- 11681 Chester Ave
- 12642 George St
- 12632 Glen St
- 12651 Glen St
- 12592 Glen St
- 11671 Chester Ave
- 11721 Chester Ave