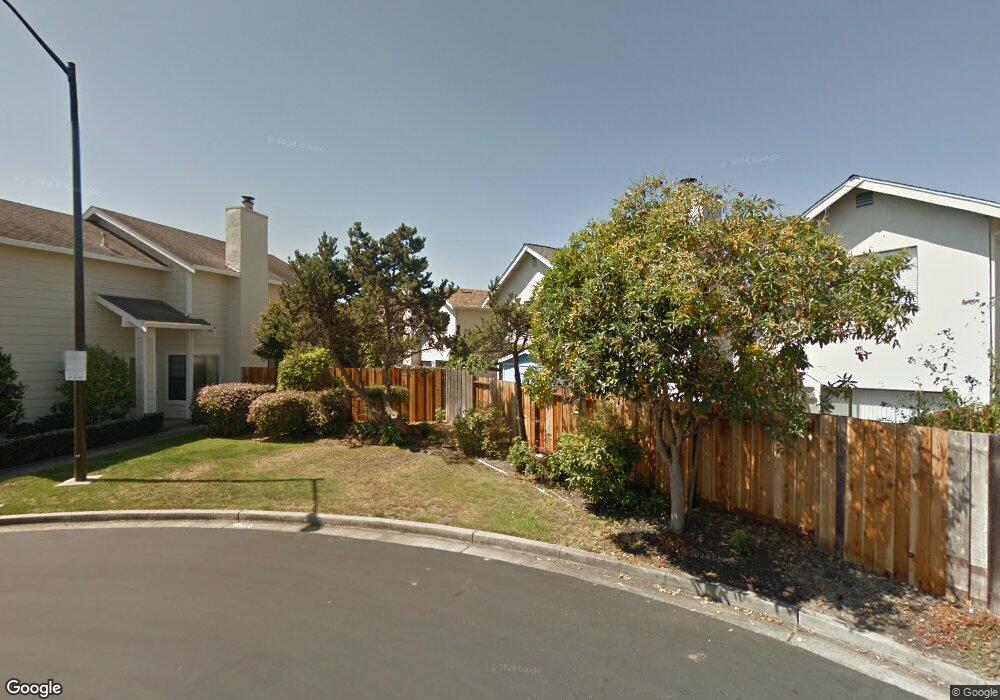
1262 Clarke Ln Alameda, CA 94502
Harbor Bay/Bay Farm NeighborhoodEstimated Value: $1,111,050 - $1,310,000
3
Beds
3
Baths
1,371
Sq Ft
$879/Sq Ft
Est. Value
About This Home
This home is located at 1262 Clarke Ln, Alameda, CA 94502 and is currently estimated at $1,204,763, approximately $878 per square foot. 1262 Clarke Ln is a home located in Alameda County with nearby schools including Amelia Earhart Elementary School, Lincoln Middle School, and Alameda High School.
Ownership History
Date
Name
Owned For
Owner Type
Purchase Details
Closed on
Sep 24, 2003
Sold by
Wong Leung Andrew H H and Wong Leung Chung Ki
Bought by
Lee Steve
Current Estimated Value
Home Financials for this Owner
Home Financials are based on the most recent Mortgage that was taken out on this home.
Original Mortgage
$416,000
Outstanding Balance
$191,388
Interest Rate
6.12%
Mortgage Type
Purchase Money Mortgage
Estimated Equity
$1,013,375
Purchase Details
Closed on
Jul 21, 2003
Sold by
Leung Patrick Kin Sang
Bought by
Wong Leung Andrew H H and Wong Leung Chung Ki
Purchase Details
Closed on
Mar 21, 1995
Sold by
Hazen Donald James and Hazen Shirley Ann
Bought by
Wong Leung Andrew H H and Wong Leung Chung Ki
Home Financials for this Owner
Home Financials are based on the most recent Mortgage that was taken out on this home.
Original Mortgage
$211,265
Interest Rate
7.62%
Create a Home Valuation Report for This Property
The Home Valuation Report is an in-depth analysis detailing your home's value as well as a comparison with similar homes in the area
Home Values in the Area
Average Home Value in this Area
Purchase History
| Date | Buyer | Sale Price | Title Company |
|---|---|---|---|
| Lee Steve | $520,000 | Alliance Title Company | |
| Wong Leung Andrew H H | -- | -- | |
| Wong Leung Andrew H H | $235,000 | Chicago Title Co |
Source: Public Records
Mortgage History
| Date | Status | Borrower | Loan Amount |
|---|---|---|---|
| Open | Lee Steve | $416,000 | |
| Previous Owner | Wong Leung Andrew H H | $211,265 | |
| Closed | Lee Steve | $100,000 |
Source: Public Records
Tax History Compared to Growth
Tax History
| Year | Tax Paid | Tax Assessment Tax Assessment Total Assessment is a certain percentage of the fair market value that is determined by local assessors to be the total taxable value of land and additions on the property. | Land | Improvement |
|---|---|---|---|---|
| 2025 | $10,644 | $732,288 | $221,786 | $517,502 |
| 2024 | $10,644 | $717,796 | $217,439 | $507,357 |
| 2023 | $10,236 | $710,584 | $213,175 | $497,409 |
| 2022 | $10,005 | $689,654 | $208,996 | $487,658 |
| 2021 | $9,758 | $675,998 | $204,899 | $478,099 |
| 2020 | $9,639 | $676,000 | $202,800 | $473,200 |
| 2019 | $9,192 | $662,744 | $198,823 | $463,921 |
| 2018 | $8,856 | $649,750 | $194,925 | $454,825 |
| 2017 | $8,546 | $637,010 | $191,103 | $445,907 |
| 2016 | $8,557 | $624,520 | $187,356 | $437,164 |
| 2015 | $8,528 | $615,138 | $184,541 | $430,597 |
| 2014 | $8,136 | $603,090 | $180,927 | $422,163 |
Source: Public Records
Map
Nearby Homes
- 3530 Depassier Way
- 3525 Mcsherry Way
- 3521 Oleander Ave
- 1083 Melrose Ave
- 1042 Mangrove Ln
- 3344 Solomon Ln
- 1042 Jost Ln
- 3337 Solomon Ln
- 3334 Solomon Ln
- 3315 Willis Ln
- 3308 Fir Ave
- 1031 Camellia Dr
- 133 Mecartney Rd
- 127 Maitland Dr
- 1160 Marianas Ln
- 327 Ratto Rd
- 1117 Camino Del Valle
- 3109 La Campania
- 1104 Verdemar Dr
- 1131 Via Alamosa