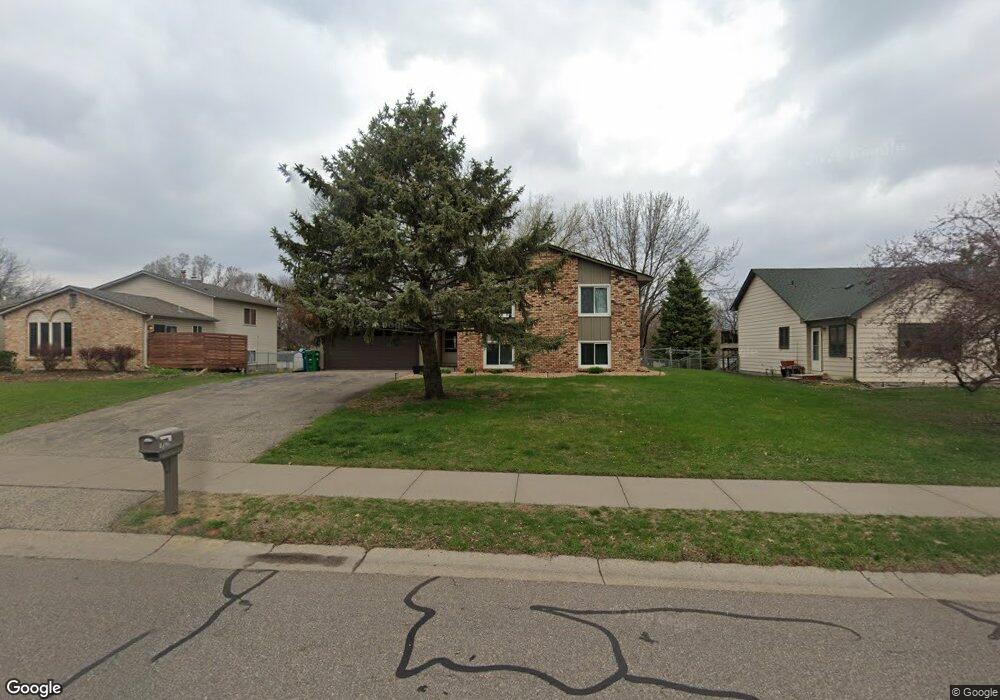
12620 73rd Ave N Maple Grove, MN 55369
Estimated Value: $415,241 - $445,000
4
Beds
2
Baths
2,191
Sq Ft
$195/Sq Ft
Est. Value
About This Home
This home is located at 12620 73rd Ave N, Maple Grove, MN 55369 and is currently estimated at $426,310, approximately $194 per square foot. 12620 73rd Ave N is a home located in Hennepin County with nearby schools including Cedar Island Elementary School, Maple Grove Middle School, and Osseo Senior High School.
Ownership History
Date
Name
Owned For
Owner Type
Purchase Details
Closed on
Dec 10, 2020
Sold by
Michels Love G
Bought by
Pederson Sam R and Wagner Catherine
Current Estimated Value
Home Financials for this Owner
Home Financials are based on the most recent Mortgage that was taken out on this home.
Original Mortgage
$332,500
Outstanding Balance
$296,024
Interest Rate
2.7%
Mortgage Type
New Conventional
Estimated Equity
$130,286
Purchase Details
Closed on
Nov 15, 2016
Sold by
Fryaman Veniamin and Fryaman Nadia
Bought by
Michels Aaron P and Michels Love G
Home Financials for this Owner
Home Financials are based on the most recent Mortgage that was taken out on this home.
Original Mortgage
$247,000
Interest Rate
3.52%
Mortgage Type
New Conventional
Purchase Details
Closed on
Jul 17, 2009
Sold by
Federal Home Loan Mortgage Corporation
Bought by
Frayman Veniamin and Frayman Nadia
Purchase Details
Closed on
Apr 23, 1998
Sold by
Uppal Vijay K and Uppal Shobha
Bought by
Vosberg Jason R and Vosberg Gary P
Create a Home Valuation Report for This Property
The Home Valuation Report is an in-depth analysis detailing your home's value as well as a comparison with similar homes in the area
Home Values in the Area
Average Home Value in this Area
Purchase History
| Date | Buyer | Sale Price | Title Company |
|---|---|---|---|
| Pederson Sam R | $350,000 | Titlesmart Inc | |
| Michels Aaron P | $267,879 | Title Smart Inc | |
| Frayman Veniamin | $171,200 | -- | |
| Vosberg Jason R | $121,000 | -- | |
| Pederson Sam Sam | $350,000 | -- |
Source: Public Records
Mortgage History
| Date | Status | Borrower | Loan Amount |
|---|---|---|---|
| Open | Pederson Sam R | $332,500 | |
| Previous Owner | Michels Aaron P | $247,000 | |
| Closed | Pederson Sam Sam | $332,500 |
Source: Public Records
Tax History Compared to Growth
Tax History
| Year | Tax Paid | Tax Assessment Tax Assessment Total Assessment is a certain percentage of the fair market value that is determined by local assessors to be the total taxable value of land and additions on the property. | Land | Improvement |
|---|---|---|---|---|
| 2024 | $4,559 | $378,700 | $115,500 | $263,200 |
| 2023 | $4,457 | $380,800 | $112,400 | $268,400 |
| 2022 | $3,831 | $389,600 | $106,200 | $283,400 |
| 2021 | $3,595 | $318,500 | $84,300 | $234,200 |
| 2020 | $3,757 | $297,900 | $69,900 | $228,000 |
| 2019 | $3,434 | $297,500 | $81,600 | $215,900 |
| 2018 | $3,234 | $260,400 | $67,600 | $192,800 |
| 2017 | $3,187 | $231,100 | $66,000 | $165,100 |
| 2016 | $3,114 | $223,500 | $64,000 | $159,500 |
| 2015 | $3,090 | $216,500 | $64,000 | $152,500 |
| 2014 | -- | $198,900 | $64,000 | $134,900 |
Source: Public Records
Map
Nearby Homes
- 12585 74th Ave N
- 7169 Birchview Rd
- 7285 Kirkwood Ln N
- 7486 Vinewood Ct Unit 7486
- 7536 Vinewood Ct
- 7533 Vinewood Ct
- 7577 Vinewood Ct
- 7523 Wedgewood Way N
- 7331 Berkshire Way
- 7573 Wedgewood Way Unit 7573
- 6905 Ives Ln N
- 6942 Ives Ln N
- 7592 Zinnia Way
- 13960 71st Ave N
- 8025 Larch Ln N
- 8142 Oakview Ln N Unit 53
- 7071 Empire Ln N
- 11081 69th Place N
- 12225 82nd Ave N Unit 66
- 7000 Yorktown Ln N
- 12648 12648 73rd-Avenue-n
- 12592 73rd Ave N
- 12576 73rd Ave N
- 7328 Pineview Ln N
- 7312 Pineview Ln N
- 7340 Pineview Ln N
- 12560 12560 73rd-Avenue-n
- 12560 73rd Ave N
- 12544 73rd Ave N
- 12623 73rd Ave N
- 12623 12623 73rd-Avenue-n
- 12575 73rd Ave N
- 19315 74th Ave N
- 19323 74th Ave N
- 19320 74th Ave N
- 12655 73rd Ave N
- 12549 73rd Ave N
- 7339 Pineview Ln N
- 12500 73rd Ave N
- 7325 Pineview Ln N