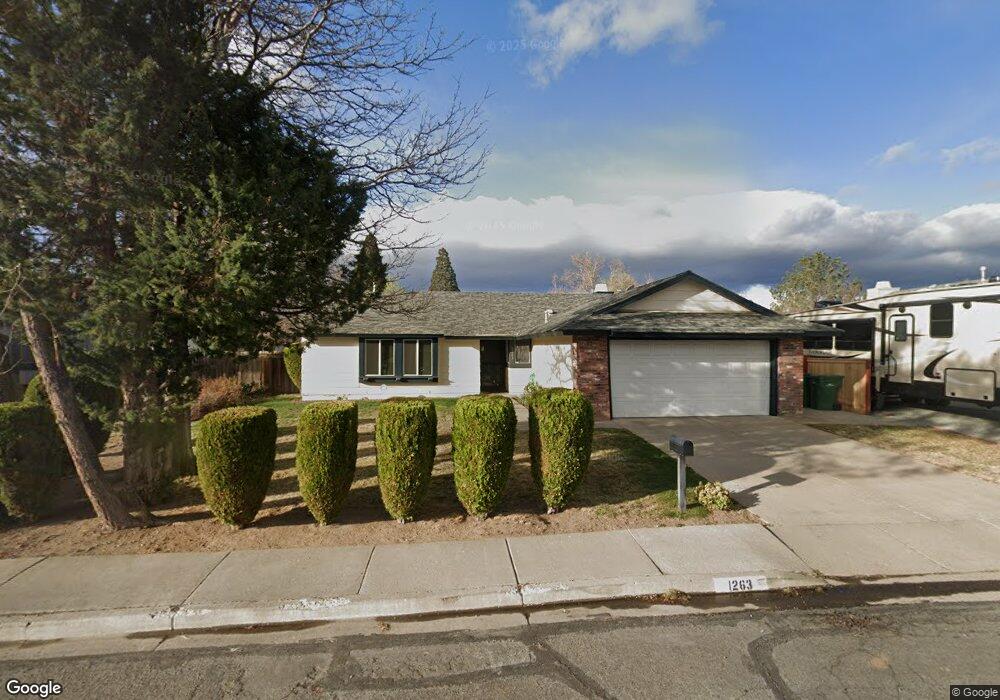
1263 Junction Dr Sparks, NV 89434
O'Callaghan NeighborhoodEstimated Value: $423,000 - $453,000
3
Beds
2
Baths
1,397
Sq Ft
$316/Sq Ft
Est. Value
About This Home
This home is located at 1263 Junction Dr, Sparks, NV 89434 and is currently estimated at $440,995, approximately $315 per square foot. 1263 Junction Dr is a home located in Washoe County with nearby schools including Katherine Dunn Elementary School, George L Dilworth Middle School, and Edward C Reed High School.
Ownership History
Date
Name
Owned For
Owner Type
Purchase Details
Closed on
Jun 25, 2024
Sold by
Danner Vangie M
Bought by
Vangie M Danner Living Trust
Current Estimated Value
Purchase Details
Closed on
Nov 17, 2016
Sold by
Danner Richard D
Bought by
Danner Vangie M
Home Financials for this Owner
Home Financials are based on the most recent Mortgage that was taken out on this home.
Original Mortgage
$223,500
Interest Rate
3.42%
Mortgage Type
New Conventional
Purchase Details
Closed on
Mar 9, 2005
Sold by
Danner Richard D and Danner Vangie M
Bought by
Danner Vangie M
Purchase Details
Closed on
Oct 7, 2004
Sold by
Danner Vangie M
Bought by
Danner Richard D and Danner Vangie M
Purchase Details
Closed on
Jul 13, 2004
Sold by
Danner Vangie M and Danner Richard D
Bought by
Danner Vangie M
Create a Home Valuation Report for This Property
The Home Valuation Report is an in-depth analysis detailing your home's value as well as a comparison with similar homes in the area
Home Values in the Area
Average Home Value in this Area
Purchase History
| Date | Buyer | Sale Price | Title Company |
|---|---|---|---|
| Vangie M Danner Living Trust | -- | None Listed On Document | |
| Danner Vangie M | -- | First American Title Reno | |
| Danner Vangie M | -- | -- | |
| Danner Richard D | -- | Old Republic Natl Title Ins | |
| Danner Vangie M | -- | -- |
Source: Public Records
Mortgage History
| Date | Status | Borrower | Loan Amount |
|---|---|---|---|
| Previous Owner | Danner Vangie M | $223,500 |
Source: Public Records
Tax History
| Year | Tax Paid | Tax Assessment Tax Assessment Total Assessment is a certain percentage of the fair market value that is determined by local assessors to be the total taxable value of land and additions on the property. | Land | Improvement |
|---|---|---|---|---|
| 2026 | $1,135 | $63,541 | $36,383 | $27,159 |
| 2024 | $1,476 | $63,496 | $34,361 | $29,134 |
| 2023 | $1,434 | $62,075 | $33,920 | $28,154 |
| 2022 | $1,398 | $51,212 | $27,305 | $23,907 |
| 2021 | $1,354 | $45,082 | $20,837 | $24,245 |
| 2020 | $1,311 | $45,487 | $20,764 | $24,723 |
| 2019 | $1,273 | $44,185 | $19,882 | $24,303 |
| 2018 | $1,236 | $38,827 | $14,663 | $24,164 |
| 2017 | $1,200 | $37,865 | $13,304 | $24,561 |
| 2016 | $1,171 | $37,398 | $11,981 | $25,417 |
| 2015 | $1,169 | $35,945 | $10,106 | $25,839 |
| 2014 | $1,112 | $33,228 | $8,636 | $24,592 |
| 2013 | -- | $29,675 | $6,395 | $23,280 |
Source: Public Records
Map
Nearby Homes
- 1218 Junction Dr
- 1308 Coachman Dr
- 1544 Woodhaven Ln
- 1262 Union St
- 1012 Alta Vista Dr
- 960 Cherry Tree Dr Unit 1
- 860 Cherry Tree Dr Unit 2
- 675 Parlanti Ln Unit 124
- 675 Parlanti Ln Unit 38
- 675 Parlanti Ln Unit 11
- 675 Parlanti Ln Unit 42
- 675 Parlanti Ln Unit 9
- 675 Parlanti Ln Unit 88
- 675 Parlanti Ln Unit 63
- 1236 Flora Glen Dr
- 995 Sage View Dr
- 2140 Burnside Dr
- 1954 Rio Tinto Dr
- 828 Woodglen Dr Unit 2
- 801 Woodglen Dr Unit 2
- 1267 Junction Dr
- 1255 Junction Ct
- 1259 Junction Dr
- 1249 Junction Ct
- 1256 Pullman Dr Unit 1
- 1252 Pullman Dr
- 1260 Junction Dr
- 1260 Pullman Dr
- 1248 Pullman Dr
- 1256 Junction Dr Unit 1
- 1279 Junction Dr
- 1264 Pullman Dr
- 1272 Junction Dr
- 1252 Junction Dr
- 1240 Pullman Dr
- 1229 Junction Ct
- 1268 Pullman Dr Unit 1
- 1223 Junction Dr
- 1285 Coachman Dr
- 1241 Junction Ct
Your Personal Tour Guide
Ask me questions while you tour the home.