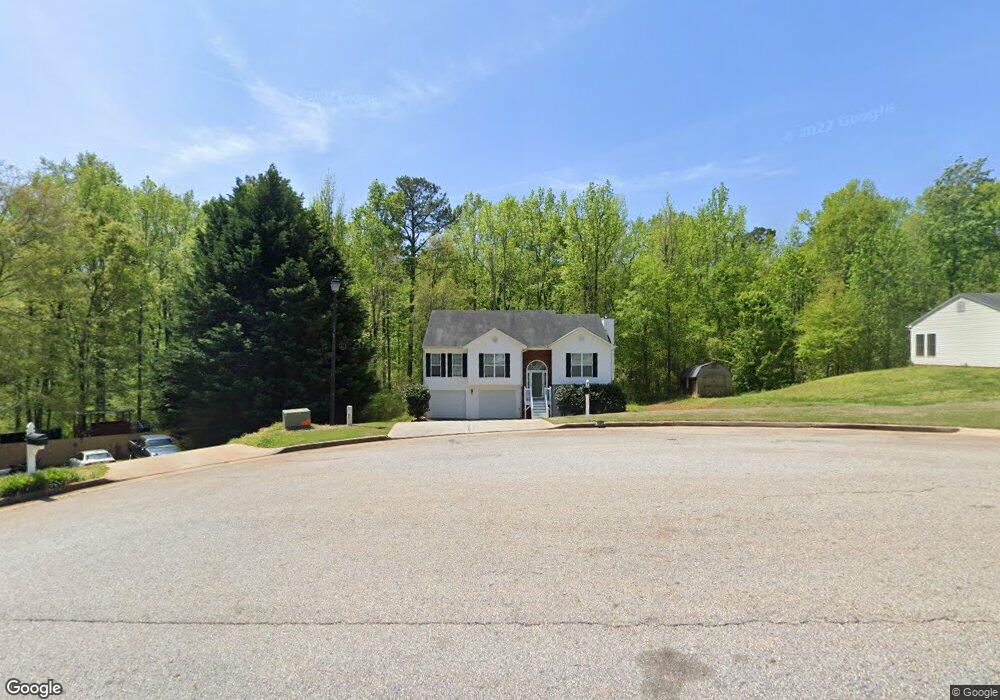
1265 Persimmon Place Dr Unit 3 Bethlehem, GA 30620
Estimated Value: $331,052 - $362,000
3
Beds
2
Baths
1,781
Sq Ft
$193/Sq Ft
Est. Value
About This Home
This home is located at 1265 Persimmon Place Dr Unit 3, Bethlehem, GA 30620 and is currently estimated at $344,263, approximately $193 per square foot. 1265 Persimmon Place Dr Unit 3 is a home located in Barrow County with nearby schools including Yargo Elementary School, Haymon-Morris Middle School, and Apalachee High School.
Ownership History
Date
Name
Owned For
Owner Type
Purchase Details
Closed on
Oct 27, 2011
Sold by
Secretary Of Housing And U
Bought by
French William and French Sonja
Current Estimated Value
Purchase Details
Closed on
Dec 7, 2010
Sold by
Mcghee Craytonia
Bought by
Wells Fargo Bk Na
Purchase Details
Closed on
Jun 21, 2004
Sold by
Southfork Hms Inc
Bought by
Mcghee Craytonia
Home Financials for this Owner
Home Financials are based on the most recent Mortgage that was taken out on this home.
Original Mortgage
$137,600
Interest Rate
6.25%
Mortgage Type
VA
Purchase Details
Closed on
Jan 9, 2004
Sold by
Parkview Development Inc
Bought by
Southfork Homes Inc
Purchase Details
Closed on
May 2, 2000
Bought by
Parkview Development Inc
Create a Home Valuation Report for This Property
The Home Valuation Report is an in-depth analysis detailing your home's value as well as a comparison with similar homes in the area
Home Values in the Area
Average Home Value in this Area
Purchase History
| Date | Buyer | Sale Price | Title Company |
|---|---|---|---|
| French William | $48,002 | -- | |
| Wells Fargo Bk Na | $148,539 | -- | |
| Mcghee Craytonia | $139,900 | -- | |
| Southfork Homes Inc | $750,000 | -- | |
| Parkview Development Inc | -- | -- |
Source: Public Records
Mortgage History
| Date | Status | Borrower | Loan Amount |
|---|---|---|---|
| Previous Owner | Mcghee Craytonia | $137,600 |
Source: Public Records
Tax History Compared to Growth
Tax History
| Year | Tax Paid | Tax Assessment Tax Assessment Total Assessment is a certain percentage of the fair market value that is determined by local assessors to be the total taxable value of land and additions on the property. | Land | Improvement |
|---|---|---|---|---|
| 2024 | $2,980 | $118,195 | $25,200 | $92,995 |
| 2023 | $2,981 | $118,595 | $25,200 | $93,395 |
| 2022 | $2,543 | $86,563 | $20,000 | $66,563 |
| 2021 | $2,371 | $75,946 | $16,000 | $59,946 |
| 2020 | $2,112 | $67,125 | $16,000 | $51,125 |
| 2019 | $2,149 | $67,125 | $16,000 | $51,125 |
| 2018 | $2,042 | $64,325 | $13,200 | $51,125 |
| 2017 | $1,591 | $54,640 | $13,200 | $41,440 |
| 2016 | $1,477 | $46,193 | $13,200 | $32,993 |
| 2015 | $1,495 | $46,555 | $13,200 | $33,355 |
| 2014 | $1,344 | $40,185 | $6,468 | $33,717 |
| 2013 | -- | $38,042 | $6,468 | $31,574 |
Source: Public Records
Map
Nearby Homes
- 0 Jb Owens Unit 7552902
- 0 Jb Owens Unit 7552891
- 0 Jb Owens Unit LOT 2 - 2.09 ACRES
- 0 Jb Owens Unit LOT 3 - 2.01 ACRES
- 763 Moss Side Dr
- 190 Lokeys Ln
- 1071 Covenant Ct
- 0 Tanners Bridge Rd Unit 10588144
- 637 Sleeping Meadow Ln
- 286 Meadows Dr
- 303 Ron Dr
- 103 Camp Ct
- 384 Winslow Ct
- 758 Clarence Edwards Rd
- 209 Angie Way
- 3153 Lowell Rd
- 468 Grand Oaks Ave
- 1129 Loganville Hwy
- 0 Tanners Bridge Cir Unit 10536031
- 1111 Otis Dr
- 1265 Persimmon Place Dr Unit 24A
- 1263 Persimmon Place Dr Unit 25A
- 1263 Persimmon Place Dr Unit 3
- 1528 Persimmon Place Dr Unit 15D
- 1261 Persimmon Place Dr Unit 3
- 1261 Persimmon Place Dr
- 1267 Persimmon Place Dr Unit 23A
- 1267 Persimmon Place Dr
- 1554 Mill Creek Rd
- 1259 Persimmon Place Dr Unit 27A
- 1259 Persimmon Place Dr
- 1266 Persimmon Place Dr Unit 22A
- 1266 Persimmon Place Dr Unit 3
- 1264 Persimmon Place Dr Unit 21A
- 1264 Persimmon Place Dr
- 584 Pin Oak Dr Unit 20A
- 584 Pin Oak Dr Unit 3
- 1552 Mill Creek Rd
- 1552 Mill Creek Rd Unit 1
- 1550 Mill Creek Rd Unit 1