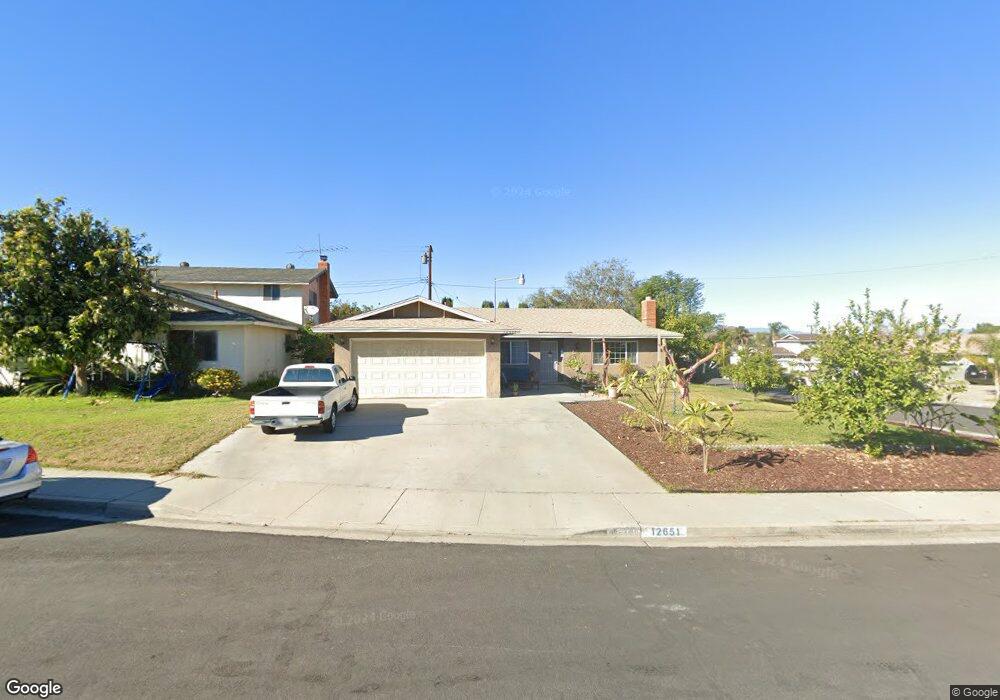
12651 Buttonwood Cir Riverside, CA 92503
Estimated Value: $594,303 - $655,000
4
Beds
2
Baths
1,450
Sq Ft
$433/Sq Ft
Est. Value
About This Home
This home is located at 12651 Buttonwood Cir, Riverside, CA 92503 and is currently estimated at $627,826, approximately $432 per square foot. 12651 Buttonwood Cir is a home located in Riverside County with nearby schools including Phillip M. Stokoe Elementary School, Ysmael Villegas Middle School, and Hillcrest High School.
Ownership History
Date
Name
Owned For
Owner Type
Purchase Details
Closed on
Sep 22, 2016
Sold by
Zepeda Genaro and Zepeda Maria J
Bought by
Zepeda Genaro and Zepeda Maria J
Current Estimated Value
Home Financials for this Owner
Home Financials are based on the most recent Mortgage that was taken out on this home.
Original Mortgage
$217,000
Interest Rate
3.43%
Mortgage Type
New Conventional
Purchase Details
Closed on
Feb 15, 2007
Sold by
Zepeda Maria J
Bought by
Zepeda Genaro and Zepeda Maria J
Home Financials for this Owner
Home Financials are based on the most recent Mortgage that was taken out on this home.
Original Mortgage
$209,000
Interest Rate
6.37%
Mortgage Type
New Conventional
Purchase Details
Closed on
Dec 21, 2006
Sold by
Zepeda Genaro
Bought by
Zepeda Maria J
Home Financials for this Owner
Home Financials are based on the most recent Mortgage that was taken out on this home.
Original Mortgage
$209,000
Interest Rate
6.37%
Mortgage Type
New Conventional
Create a Home Valuation Report for This Property
The Home Valuation Report is an in-depth analysis detailing your home's value as well as a comparison with similar homes in the area
Home Values in the Area
Average Home Value in this Area
Purchase History
| Date | Buyer | Sale Price | Title Company |
|---|---|---|---|
| Zepeda Genaro | -- | Fidelity National Title | |
| Zepeda Genaro | -- | Commonwealth Land Title Co | |
| Zepeda Maria J | -- | Commonwealth Land Title Co |
Source: Public Records
Mortgage History
| Date | Status | Borrower | Loan Amount |
|---|---|---|---|
| Closed | Zepeda Genaro | $217,000 | |
| Closed | Zepeda Maria J | $209,000 |
Source: Public Records
Tax History
| Year | Tax Paid | Tax Assessment Tax Assessment Total Assessment is a certain percentage of the fair market value that is determined by local assessors to be the total taxable value of land and additions on the property. | Land | Improvement |
|---|---|---|---|---|
| 2025 | $3,125 | $263,046 | $91,966 | $171,080 |
| 2023 | $3,125 | $252,834 | $88,396 | $164,438 |
| 2022 | $2,878 | $247,877 | $86,663 | $161,214 |
| 2021 | $2,817 | $243,017 | $84,964 | $158,053 |
| 2020 | $2,770 | $240,526 | $84,093 | $156,433 |
| 2019 | $2,731 | $235,811 | $82,445 | $153,366 |
| 2018 | $2,690 | $231,188 | $80,830 | $150,358 |
| 2017 | $2,638 | $226,656 | $79,246 | $147,410 |
| 2016 | $2,592 | $222,213 | $77,693 | $144,520 |
| 2015 | $2,554 | $218,877 | $76,527 | $142,350 |
| 2014 | $2,544 | $214,591 | $75,029 | $139,562 |
Source: Public Records
Map
Nearby Homes
- 12671 Hollyglen Cir
- 3565 Dixie Ln
- 12740 Tehama Cir
- 3447 Yuba Cir
- 12840 Mayflower Ct
- 3700 Buchanan St Unit 180
- 3700 Buchanan St Unit 98
- 3700 Buchanan St Unit 189
- 3700 Buchanan St Unit 25
- 3700 Buchanan St Unit 132
- 3700 Buchanan St Unit 105
- 3700 Buchanan St Unit 108
- 3700 Buchanan St Unit 164
- 3700 Buchanan Ave Unit 72
- 3700 Buchanan Ave Unit 25
- 3500 Buchanan St Unit 120
- 3500 Buchanan St Unit 24
- 3500 Buchanan St Unit 145
- 3500 Buchanan St Unit 173
- 3500 Buchanan St Unit 103
- 12667 Buttonwood Cir
- 12650 Dogwood Cir
- 12660 Dogwood Cir
- 3635 Dixie Ln
- 12689 Buttonwood Cir
- 3627 Dixie Ln
- 3645 Dixie Ln
- 12676 Dogwood Cir
- 12660 Buttonwood Cir
- 12690 Buttonwood Cir
- 3621 Dixie Ln
- 3655 Dixie Ln
- 12676 Buttonwood Cir
- 12690 Dogwood Cir
- 3611 Dixie Ln
- 12657 Dogwood Cir
- 12645 Dogwood Cir
- 12661 Hollyglen Cir
- 3665 Dixie Ln
- 12671 Dogwood Cir
Your Personal Tour Guide
Ask me questions while you tour the home.