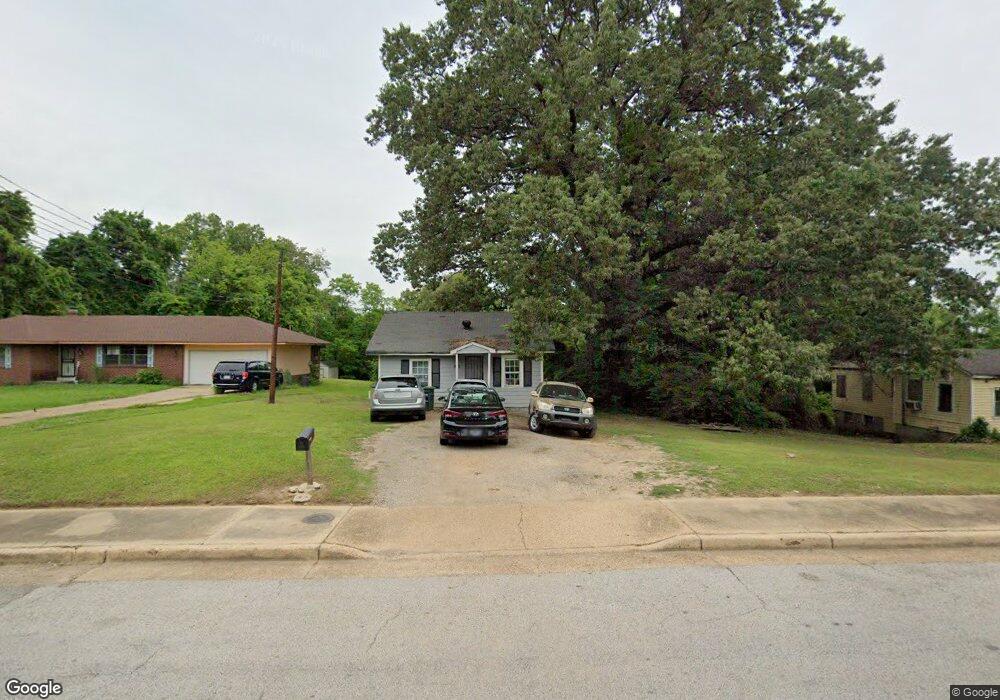
1266 E Alcy Rd Memphis, TN 38106
Southeast Memphis NeighborhoodEstimated Value: $48,000 - $82,000
2
Beds
1
Bath
625
Sq Ft
$98/Sq Ft
Est. Value
About This Home
This home is located at 1266 E Alcy Rd, Memphis, TN 38106 and is currently estimated at $61,390, approximately $98 per square foot. 1266 E Alcy Rd is a home located in Shelby County with nearby schools including Hamilton High School, Memphis College Preparatory, and Veritas College Preparatory.
Ownership History
Date
Name
Owned For
Owner Type
Purchase Details
Closed on
Jul 14, 2017
Sold by
Williams Ii Patrick
Bought by
Hopson Ora
Current Estimated Value
Purchase Details
Closed on
Dec 9, 2015
Sold by
County Of Shelby
Bought by
Williams Ii Patrick
Purchase Details
Closed on
Jul 22, 2010
Sold by
Bady Sean and Bady Sarah
Bought by
Deutsche Bank National Trust Company and Bankers Trust Company Of California Na
Purchase Details
Closed on
Jan 28, 2008
Sold by
Braden Braden & Braden Llc
Bought by
Citifinancial
Purchase Details
Closed on
Mar 9, 2007
Sold by
Bady Sean B and Bady Sarah
Bought by
Braden Braden & Braden Llc
Purchase Details
Closed on
Mar 29, 1999
Sold by
Morgan Vearble Geneva
Bought by
Bady Sean and Bady Sarah
Home Financials for this Owner
Home Financials are based on the most recent Mortgage that was taken out on this home.
Original Mortgage
$11,852
Interest Rate
6.82%
Mortgage Type
Credit Line Revolving
Create a Home Valuation Report for This Property
The Home Valuation Report is an in-depth analysis detailing your home's value as well as a comparison with similar homes in the area
Home Values in the Area
Average Home Value in this Area
Purchase History
| Date | Buyer | Sale Price | Title Company |
|---|---|---|---|
| Hopson Ora | -- | None Available | |
| Williams Ii Patrick | $2,550 | Attorney | |
| Deutsche Bank National Trust Company | $52,022 | None Available | |
| Citifinancial | -- | None Available | |
| Braden Braden & Braden Llc | -- | None Available | |
| Bady Sean | $12,500 | Security Title Company Inc | |
| Bady Sean | $12,500 | Security Title Company Inc |
Source: Public Records
Mortgage History
| Date | Status | Borrower | Loan Amount |
|---|---|---|---|
| Previous Owner | Bady Sean | $11,852 |
Source: Public Records
Tax History
| Year | Tax Paid | Tax Assessment Tax Assessment Total Assessment is a certain percentage of the fair market value that is determined by local assessors to be the total taxable value of land and additions on the property. | Land | Improvement |
|---|---|---|---|---|
| 2025 | $174 | $8,750 | $3,650 | $5,100 |
| 2024 | $174 | $5,125 | $2,700 | $2,425 |
| 2023 | $312 | $5,125 | $2,700 | $2,425 |
| 2022 | $312 | $5,125 | $2,700 | $2,425 |
| 2021 | $316 | $5,125 | $2,700 | $2,425 |
| 2020 | $440 | $6,075 | $2,700 | $3,375 |
| 2019 | $440 | $6,075 | $2,700 | $3,375 |
| 2018 | $440 | $6,075 | $2,700 | $3,375 |
| 2017 | $250 | $6,075 | $2,700 | $3,375 |
| 2016 | $257 | $5,875 | $0 | $0 |
| 2014 | $257 | $5,875 | $0 | $0 |
Source: Public Records
Map
Nearby Homes
- 1217 Carlton Rd
- 1263 Newark Ave
- 2340 Hernando Rd
- 2394 Warren St
- 0 Carlton Rd
- 1078 N Ball Rd
- 2344 Warren St
- 1490 Lockhaven Ave
- 1493 E Alcy Rd
- 2601 Darlene St
- 2440 Sparks St
- 2180 Elvis Presley Blvd
- 1366 Eloise Rd
- 1540 Clementine Rd
- 904 N Ball Rd
- 1463 Effie Rd
- 1478 Effie Rd
- 0 Bridgeport Dr Unit 10214295
- 867 E Alcy Rd
- 2525 Rozelle St
- 1272 E Alcy Rd
- 1254 E Alcy Rd
- 1257 E Alcy Rd
- 1248 E Alcy Rd
- 1249 E Alcy Rd
- 1277 E Alcy Rd
- 1236 E Alcy Rd
- 2453 Elvis Presley Blvd
- 2449 Elvis Presley Blvd
- 1239 E Alcy Rd
- 1235 E Alcy Rd
- 1231 E Alcy Rd
- 1225 E Alcy Rd
- 1262 Carlton Rd
- 1254 Carlton Rd
- 1270 Carlton Rd
- 1248 Carlton Rd
- 1278 Carlton Rd
- 1221 E Alcy Rd
- 1244 Carlton Rd
Your Personal Tour Guide
Ask me questions while you tour the home.