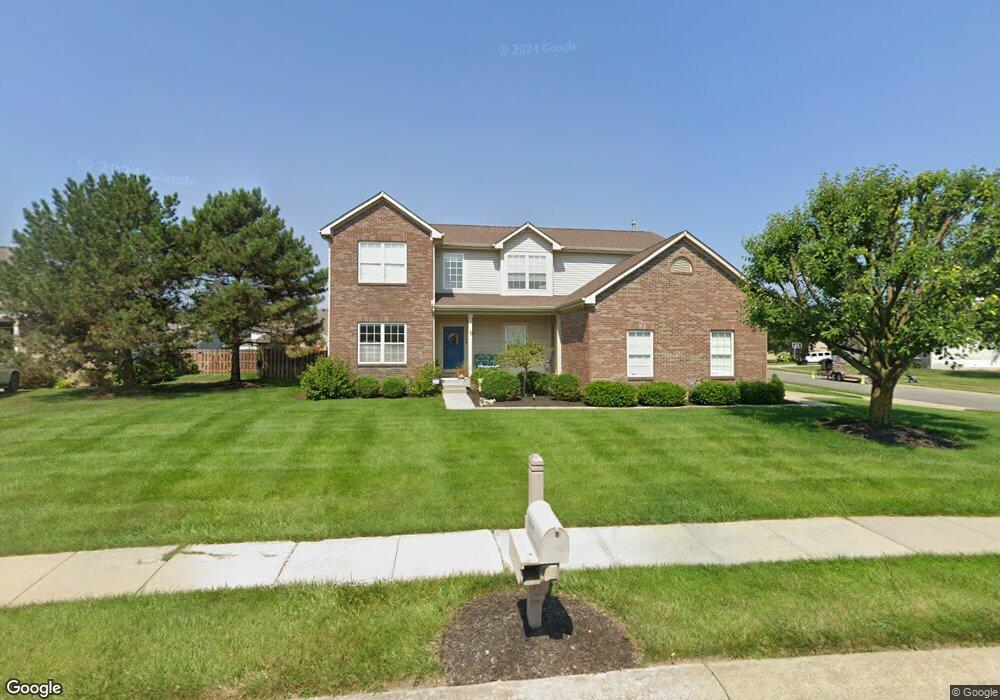
12664 Raiders Blvd Fishers, IN 46037
Estimated Value: $455,000 - $538,000
4
Beds
4
Baths
3,152
Sq Ft
$161/Sq Ft
Est. Value
About This Home
This home is located at 12664 Raiders Blvd, Fishers, IN 46037 and is currently estimated at $508,646, approximately $161 per square foot. 12664 Raiders Blvd is a home located in Hamilton County with nearby schools including Stanton County Elementary School, Hoosier Road Elementary School, and Sand Creek Intermediate School.
Ownership History
Date
Name
Owned For
Owner Type
Purchase Details
Closed on
Jul 26, 2021
Sold by
Seidl Francis X and Seidl Francis X
Bought by
Seidl Francis X
Current Estimated Value
Home Financials for this Owner
Home Financials are based on the most recent Mortgage that was taken out on this home.
Original Mortgage
$258,000
Outstanding Balance
$196,112
Interest Rate
2.24%
Mortgage Type
New Conventional
Estimated Equity
$312,534
Purchase Details
Closed on
Jan 17, 2007
Sold by
Arbor Homes Llc
Bought by
Seidl Francis X
Home Financials for this Owner
Home Financials are based on the most recent Mortgage that was taken out on this home.
Original Mortgage
$219,920
Interest Rate
6.19%
Mortgage Type
Purchase Money Mortgage
Purchase Details
Closed on
Aug 21, 2003
Sold by
Manion Kristi and Manion Shawn
Bought by
Arbor Homes Llc
Purchase Details
Closed on
Dec 23, 2002
Sold by
Northside Investments Llc
Bought by
Arbor Homes Llc
Create a Home Valuation Report for This Property
The Home Valuation Report is an in-depth analysis detailing your home's value as well as a comparison with similar homes in the area
Home Values in the Area
Average Home Value in this Area
Purchase History
| Date | Buyer | Sale Price | Title Company |
|---|---|---|---|
| Seidl Francis X | -- | None Available | |
| Seidl Francis X | -- | None Available | |
| Arbor Homes Llc | -- | Accelerated Title Company | |
| Arbor Homes Llc | -- | -- |
Source: Public Records
Mortgage History
| Date | Status | Borrower | Loan Amount |
|---|---|---|---|
| Open | Seidl Francis X | $258,000 | |
| Closed | Seidl Francis X | $219,920 |
Source: Public Records
Tax History Compared to Growth
Tax History
| Year | Tax Paid | Tax Assessment Tax Assessment Total Assessment is a certain percentage of the fair market value that is determined by local assessors to be the total taxable value of land and additions on the property. | Land | Improvement |
|---|---|---|---|---|
| 2024 | $5,069 | $446,100 | $69,500 | $376,600 |
| 2023 | $5,069 | $425,300 | $69,500 | $355,800 |
| 2022 | $4,090 | $400,700 | $69,500 | $331,200 |
| 2021 | $4,090 | $330,500 | $69,500 | $261,000 |
| 2020 | $4,008 | $318,800 | $77,200 | $241,600 |
| 2019 | $3,877 | $308,000 | $58,200 | $249,800 |
| 2018 | $3,725 | $289,300 | $58,200 | $231,100 |
| 2017 | $3,278 | $257,900 | $58,200 | $199,700 |
| 2016 | $3,345 | $263,100 | $58,200 | $204,900 |
| 2014 | $2,454 | $227,500 | $58,200 | $169,300 |
| 2013 | $2,454 | $221,800 | $58,200 | $163,600 |
Source: Public Records
Map
Nearby Homes
- 12641 Chiefs Ct
- 12622 Whisper Way
- 12036 Weathered Edge Dr
- 12218 Weathered Edge Dr
- 12236 Quarterback Ln
- 12635 Touchdown Dr
- 12230 Cobblestone Dr
- 12307 Chiseled Stone Dr
- 12404 Titans Dr
- 12337 River Valley Dr
- 12075 Scoria Dr Unit 500
- 12604 Brooks School Rd
- 12599 Brookdale Dr
- 12438 Berry Patch Ln
- 13410 White Granite Dr Unit 1100
- 13415 White Granite Dr Unit 600
- 12523 Courage Crossing
- 12552 Majestic Way
- 12215 Pebble St Unit 600
- 12607 Courage Crossing
- 12644 Raiders Blvd
- 12661 Chiefs Ct
- 12681 Chiefs Ct
- 12624 Raiders Blvd
- 12663 Raiders Blvd
- 12663 Raiders Blvd Unit 32
- 12643 Raiders Blvd
- 11950 Bills Ave
- 12621 Chiefs Ct
- 12623 Raiders Blvd
- 12604 Raiders Blvd
- 11930 Bills Ave
- 11899 Bills Ave
- 12703 Raiders Blvd
- 12626 Rams Ct
- 12603 Raiders Blvd
- 12662 Chiefs Ct
- 12642 Chiefs Ct
- 12601 Chiefs Ct
- 11910 Bills Ave