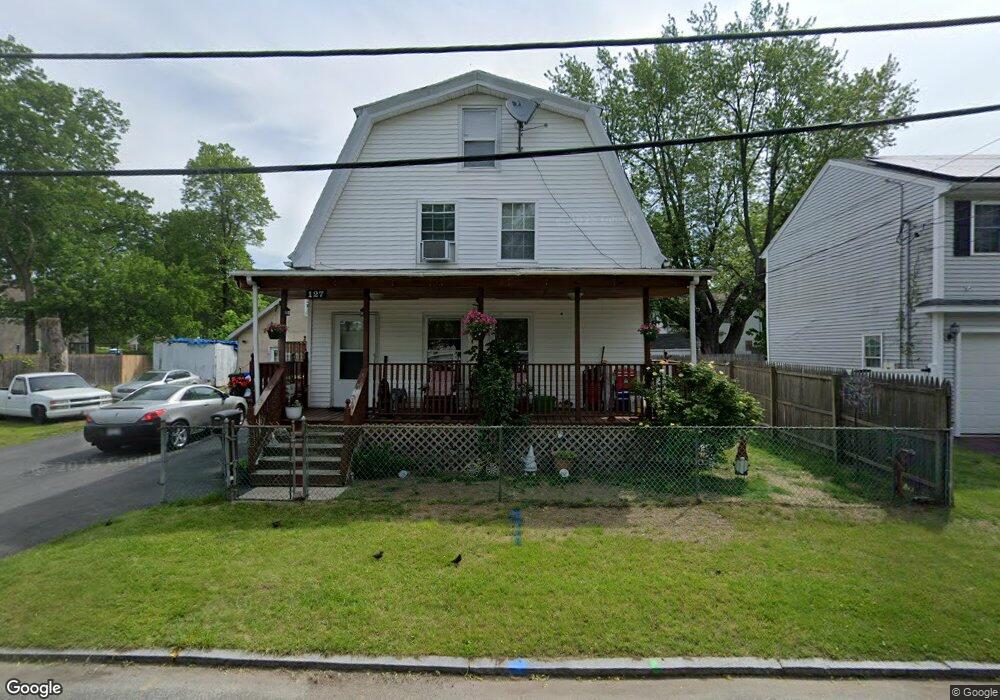
127 Elijah St Springfield, MA 01109
Pine Point NeighborhoodEstimated Value: $286,000 - $322,000
4
Beds
2
Baths
1,290
Sq Ft
$230/Sq Ft
Est. Value
About This Home
This home is located at 127 Elijah St, Springfield, MA 01109 and is currently estimated at $297,334, approximately $230 per square foot. 127 Elijah St is a home located in Hampden County with nearby schools including Hiram L. Dorman Elementary, John F. Kennedy Academy, and Springfield Central High School.
Ownership History
Date
Name
Owned For
Owner Type
Purchase Details
Closed on
Mar 31, 2011
Sold by
Fiore James W and Carnevale Anthony
Bought by
Sanchez Epifanio
Current Estimated Value
Home Financials for this Owner
Home Financials are based on the most recent Mortgage that was taken out on this home.
Original Mortgage
$94,900
Interest Rate
5.04%
Mortgage Type
Purchase Money Mortgage
Purchase Details
Closed on
Jan 19, 2011
Sold by
Citifinancial Inc
Bought by
Carnevale Anthony and Fiore James
Purchase Details
Closed on
Aug 19, 2010
Sold by
Johnson Demertis
Bought by
Citifinancial Inc
Purchase Details
Closed on
Jul 22, 2002
Sold by
Gondela Daniel J
Bought by
Johnson Demertis
Home Financials for this Owner
Home Financials are based on the most recent Mortgage that was taken out on this home.
Original Mortgage
$88,000
Interest Rate
6.73%
Mortgage Type
Purchase Money Mortgage
Create a Home Valuation Report for This Property
The Home Valuation Report is an in-depth analysis detailing your home's value as well as a comparison with similar homes in the area
Home Values in the Area
Average Home Value in this Area
Purchase History
| Date | Buyer | Sale Price | Title Company |
|---|---|---|---|
| Sanchez Epifanio | $96,900 | -- | |
| Carnevale Anthony | $45,100 | -- | |
| Citifinancial Inc | $74,012 | -- | |
| Johnson Demertis | $88,000 | -- |
Source: Public Records
Mortgage History
| Date | Status | Borrower | Loan Amount |
|---|---|---|---|
| Closed | Sanchez Epifanio | $94,900 | |
| Previous Owner | Johnson Demertis | $88,000 |
Source: Public Records
Tax History Compared to Growth
Tax History
| Year | Tax Paid | Tax Assessment Tax Assessment Total Assessment is a certain percentage of the fair market value that is determined by local assessors to be the total taxable value of land and additions on the property. | Land | Improvement |
|---|---|---|---|---|
| 2025 | $3,591 | $229,000 | $40,900 | $188,100 |
| 2024 | $3,453 | $215,000 | $34,100 | $180,900 |
| 2023 | $2,892 | $169,600 | $31,000 | $138,600 |
| 2022 | $3,309 | $175,800 | $29,000 | $146,800 |
| 2021 | $3,007 | $159,100 | $26,400 | $132,700 |
| 2020 | $3,023 | $154,800 | $26,400 | $128,400 |
| 2019 | $2,710 | $137,700 | $26,400 | $111,300 |
| 2018 | $2,631 | $133,700 | $26,400 | $107,300 |
| 2017 | $2,316 | $117,800 | $24,400 | $93,400 |
| 2016 | $2,233 | $113,600 | $24,400 | $89,200 |
| 2015 | $1,434 | $72,900 | $24,400 | $48,500 |
Source: Public Records
Map
Nearby Homes