127 Head St Soledad, CA 93960
Estimated Value: $687,000 - $724,000
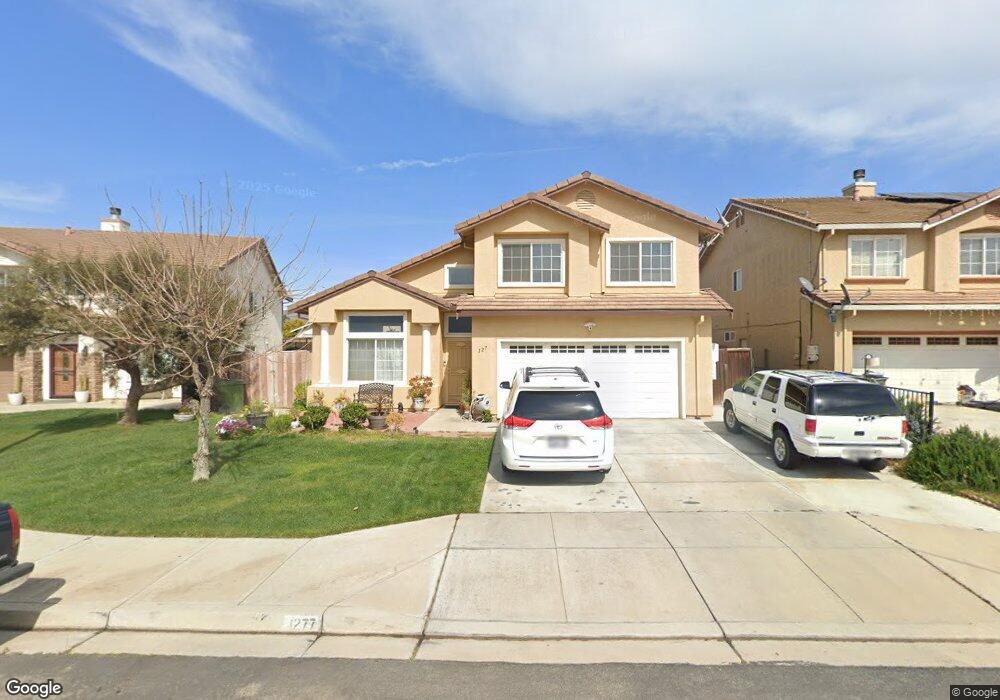
About This Home
This home is located at 127 Head St, Soledad, CA 93960 and is currently estimated at $703,413, approximately $368 per square foot. 127 Head St is a home located in Monterey County with nearby schools including Frank Ledesma Elementary School, Main Street Middle School, and Soledad High School.
Ownership History
We collect this data history from publicly available records. To have your information removed, we recommend requesting removal directly through your county’s website.
Purchase Details
Purchase Details
Home Financials for this Owner
Home Financials are based on the most recent Mortgage that was taken out on this home.Home Values in the Area
Average Home Value in this Area
Purchase History
We collect this data history from publicly available records. To have your information removed, we recommend requesting removal directly through your county’s website.
| Date | Buyer | Sale Price | Title Company |
|---|---|---|---|
| -- | None Listed On Document | ||
| $297,500 | First American Title |
Mortgage History
We collect this data history from publicly available records. To have your information removed, we recommend requesting removal directly through your county’s website.
| Date | Status | Borrower | Loan Amount |
|---|---|---|---|
| Previous Owner | $237,720 | ||
| Closed | $44,572 |
Tax History
We collect this data history from publicly available records. To have your information removed, we recommend requesting removal directly through your county’s website.
| Year | Tax Paid | Tax Assessment Tax Assessment Total Assessment is a certain percentage of the fair market value that is determined by local assessors to be the total taxable value of land and additions on the property. | Land | Improvement |
|---|---|---|---|---|
| 2025 | $5,929 | $430,368 | $137,586 | $292,782 |
| 2024 | $5,929 | $421,931 | $134,889 | $287,042 |
| 2023 | $5,433 | $413,659 | $132,245 | $281,414 |
| 2022 | $5,505 | $405,549 | $129,652 | $275,897 |
| 2021 | $5,332 | $397,598 | $127,110 | $270,488 |
| 2020 | $5,259 | $393,522 | $125,807 | $267,715 |
| 2019 | $5,166 | $385,807 | $123,341 | $262,466 |
| 2018 | $5,229 | $378,243 | $120,923 | $257,320 |
| 2017 | $5,070 | $370,827 | $118,552 | $252,275 |
| 2016 | $4,694 | $349,000 | $112,000 | $237,000 |
| 2015 | $4,373 | $321,000 | $103,000 | $218,000 |
| 2014 | $4,120 | $289,000 | $92,000 | $197,000 |
Map
- 949 Barrera St
- 317 Cliff Ct
- 449 Sage Ct
- 16 Gabilan Dr
- 34055 Front St Unit 22
- 1031 San Rafael
- 35095 Metz Rd
- 400 Granada St
- 615 Monterey St
- 805 Mora Cir
- 836 Vasquez Dr
- 0 California 146
- 102 Buena Vista Park
- 120 Buena Vista Park Unit 2
- 1117 Palm Ave
- 1 California 146
- 31102 Camphora Gloria Rd
- 31021 Camphora Rd
- 36527 Metz Rd
- 31462 El Camino Real
Ask me questions while you tour the home.