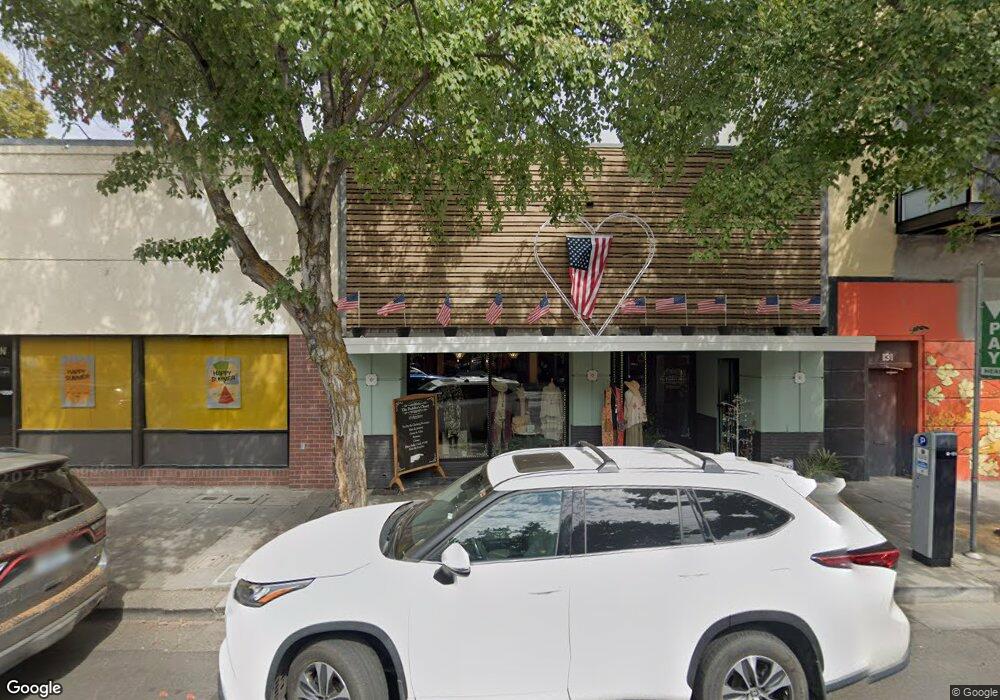
127 Main St Chico, CA 95928
Downtown Chico NeighborhoodEstimated Value: $654,586
Studio
--
Bath
2,175
Sq Ft
$301/Sq Ft
Est. Value
About This Home
This home is located at 127 Main St, Chico, CA 95928 and is currently estimated at $654,586, approximately $300 per square foot. 127 Main St is a home located in Butte County with nearby schools including Parkview Elementary School, Chico Junior High School, and Chico High School.
Ownership History
Date
Name
Owned For
Owner Type
Purchase Details
Closed on
Jan 11, 2017
Sold by
Camusi Mary Frances and Ginno Robert A
Bought by
Ginno Robert A and The Robert Ginno Living Trust
Current Estimated Value
Purchase Details
Closed on
Jul 16, 2013
Sold by
Thunen Michaele Ann and Roth Carla J
Bought by
Ginno Robert A and The Robert Ginno Living Trust
Purchase Details
Closed on
Jul 20, 2012
Sold by
Thunen Michaele Roth and Roth Carla J
Bought by
Ginno Robert A and The Robert Ginno Living Trust
Purchase Details
Closed on
Dec 28, 2006
Sold by
Roth Betty Jane and The Betty Jane Roth Trust
Bought by
Roth Betty Jane and The James F Roth Family Trust
Purchase Details
Closed on
Apr 21, 2006
Sold by
Roth Betty Jane and The Betty Jane Roth Trust
Bought by
Roth Betty Jane and The James F Roth Family Trust
Purchase Details
Closed on
Dec 17, 2000
Sold by
Butte Creek Investment Corp
Bought by
Roth Betty Jane and The Betty Jane Roth Trust
Create a Home Valuation Report for This Property
The Home Valuation Report is an in-depth analysis detailing your home's value as well as a comparison with similar homes in the area
Home Values in the Area
Average Home Value in this Area
Purchase History
| Date | Buyer | Sale Price | Title Company |
|---|---|---|---|
| Ginno Robert A | -- | Bidwell Title & Escrow Co | |
| Ginno Robert A | -- | None Available | |
| Ginno Robert A | $275,000 | Fidelity National Title Co | |
| Roth Betty Jane | $110,500 | None Available | |
| Roth Betty Jane | $160,000 | None Available | |
| Roth Betty Jane | $215,000 | Mid Valley Title & Escrow Co |
Source: Public Records
Tax History
| Year | Tax Paid | Tax Assessment Tax Assessment Total Assessment is a certain percentage of the fair market value that is determined by local assessors to be the total taxable value of land and additions on the property. | Land | Improvement |
|---|---|---|---|---|
| 2025 | $4,569 | $338,629 | $153,922 | $184,707 |
| 2024 | $4,569 | $331,990 | $150,904 | $181,086 |
| 2023 | $4,526 | $325,482 | $147,946 | $177,536 |
| 2022 | $4,426 | $319,101 | $145,046 | $174,055 |
| 2021 | $4,309 | $312,845 | $142,202 | $170,643 |
| 2020 | $4,276 | $309,638 | $140,744 | $168,894 |
| 2019 | $4,212 | $303,568 | $137,985 | $165,583 |
| 2018 | $4,127 | $297,617 | $135,280 | $162,337 |
| 2017 | $4,059 | $291,782 | $132,628 | $159,154 |
| 2016 | $3,008 | $286,062 | $130,028 | $156,034 |
| 2015 | $3,009 | $281,766 | $128,075 | $153,691 |
| 2014 | $2,936 | $276,248 | $125,567 | $150,681 |
Source: Public Records
Map
Nearby Homes
- 119 Main St
- 143 Main St
- 166 E 2nd St
- 133 Main St
- 138 Main St
- 130 Main St
- 116 W 2nd St Unit 1, 3, 4, 6
- 116 W 2nd St Unit 3, 4, 6
- 116 W 2nd St Unit 3
- 116 W 2nd St Unit 1
- 116 W 2nd St
- 116 W 2nd St Unit 6
- 116 W 2nd St Unit 2
- 116 W 2nd St Unit 4, 6
- 112 W 2nd St
- 211 Main St
- 100 Main St
- 630 E 2nd St
- 0 E 2nd St Unit 102
- 260 E 1st St
Your Personal Tour Guide
Ask me questions while you tour the home.