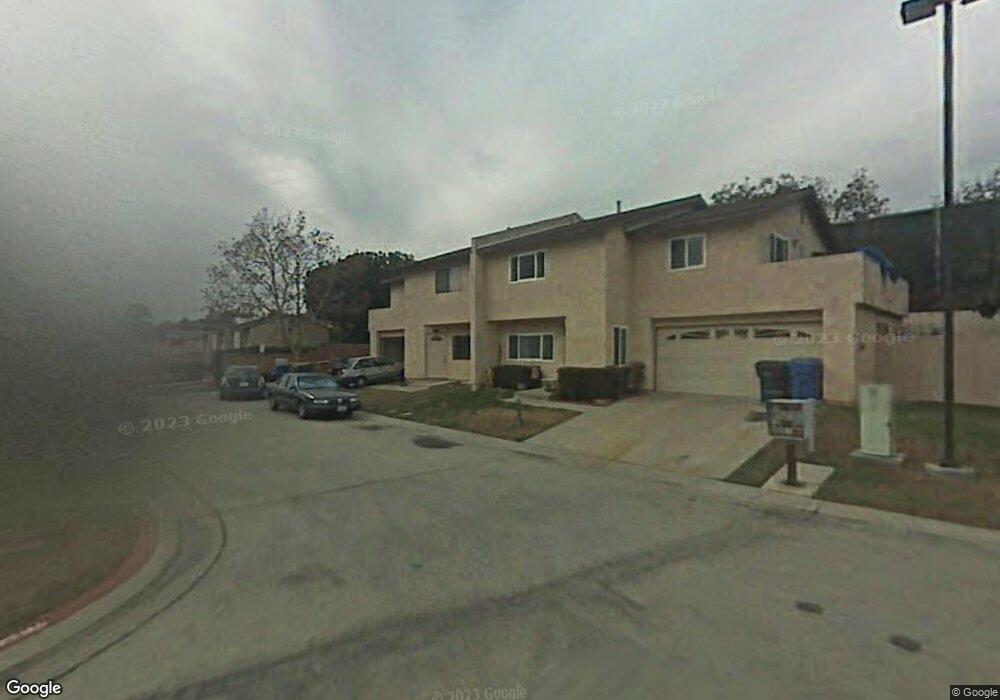
127 Marin Rd Santa Paula, CA 93060
Estimated Value: $615,000 - $810,000
3
Beds
3
Baths
1,541
Sq Ft
$435/Sq Ft
Est. Value
About This Home
This home is located at 127 Marin Rd, Santa Paula, CA 93060 and is currently estimated at $669,898, approximately $434 per square foot. 127 Marin Rd is a home located in Ventura County with nearby schools including Glen City Elementary School, Isbell Middle, and Santa Paula High.
Ownership History
Date
Name
Owned For
Owner Type
Purchase Details
Closed on
Jan 10, 2015
Sold by
Negrete Rodolfo
Bought by
Hidalgo Jorge Luis and Negrete Delia
Current Estimated Value
Purchase Details
Closed on
Jun 4, 2008
Sold by
Martinez Cynthia
Bought by
Negrete Rodolfo
Home Financials for this Owner
Home Financials are based on the most recent Mortgage that was taken out on this home.
Original Mortgage
$149,000
Outstanding Balance
$95,368
Interest Rate
6%
Mortgage Type
Purchase Money Mortgage
Estimated Equity
$574,530
Purchase Details
Closed on
Aug 12, 1996
Sold by
Mcnitt Terry E and Mcnitt Janet
Bought by
Martinez Ronald R and Martinez Cynthia
Home Financials for this Owner
Home Financials are based on the most recent Mortgage that was taken out on this home.
Original Mortgage
$111,401
Interest Rate
8.2%
Mortgage Type
FHA
Create a Home Valuation Report for This Property
The Home Valuation Report is an in-depth analysis detailing your home's value as well as a comparison with similar homes in the area
Home Values in the Area
Average Home Value in this Area
Purchase History
| Date | Buyer | Sale Price | Title Company |
|---|---|---|---|
| Hidalgo Jorge Luis | -- | None Available | |
| Negrete Rodolfo | $250,000 | United Title Company Westlak | |
| Martinez Ronald R | $112,000 | Old Republic Title Company |
Source: Public Records
Mortgage History
| Date | Status | Borrower | Loan Amount |
|---|---|---|---|
| Open | Negrete Rodolfo | $149,000 | |
| Previous Owner | Martinez Ronald R | $111,401 |
Source: Public Records
Tax History Compared to Growth
Tax History
| Year | Tax Paid | Tax Assessment Tax Assessment Total Assessment is a certain percentage of the fair market value that is determined by local assessors to be the total taxable value of land and additions on the property. | Land | Improvement |
|---|---|---|---|---|
| 2025 | $4,867 | $425,446 | $276,422 | $149,024 |
| 2024 | $4,867 | $417,104 | $271,002 | $146,102 |
| 2023 | $4,765 | $408,926 | $265,688 | $143,238 |
| 2022 | $4,629 | $400,908 | $260,478 | $140,430 |
| 2021 | $4,615 | $393,048 | $255,371 | $137,677 |
| 2020 | $4,594 | $389,019 | $252,753 | $136,266 |
| 2019 | $4,342 | $381,393 | $247,798 | $133,595 |
| 2018 | $4,287 | $373,916 | $242,940 | $130,976 |
| 2017 | $4,337 | $366,585 | $238,177 | $128,408 |
| 2016 | $4,076 | $359,398 | $233,507 | $125,891 |
| 2015 | $3,020 | $273,113 | $177,596 | $95,517 |
| 2014 | $3,068 | $267,765 | $174,118 | $93,647 |
Source: Public Records
Map
Nearby Homes
- 102 E Ventura St Unit D
- 102 E Ventura St Unit A
- 107 Sonoma Ln
- 1848 Jojoba Dr
- 413 Checkerbloom Ln
- 1856 Jojoba Dr
- 1865 Jojoba Dr
- 455 Snowdrop Ln
- 457 Snowdrop Ln
- 33 Outer Dr Unit 33
- 336 E Harvard Blvd
- 324 W Santa Barbara St
- 154 E Santa Maria St
- 352 Moultrie Place
- 362 W Santa Barbara St
- 0 Dickenson Rd
- 421 N Palm Ave
- 100 E Virginia Terrace
- 525 W Santa Barbara St
- 179 View Dr
- 129 Marin Rd
- 132 Marin Rd
- 134 Marin Rd
- 131 Marin Rd
- 138 Marin Rd
- 133 Marin Rd
- 135 Marin Rd
- 120 E Main St
- 137 Marin Rd
- 140 Marin Rd
- 129 E Ventura St Unit C
- 129 E Ventura St Unit E
- 129 E Ventura St Unit A
- 129 E Ventura St Unit F
- 129 E Ventura St Unit D
- 129 E Ventura St Unit B
- 139 Marin Rd
- 127 E Ventura St
- 127 E Ventura St Unit B
- 127 E Ventura St Unit E