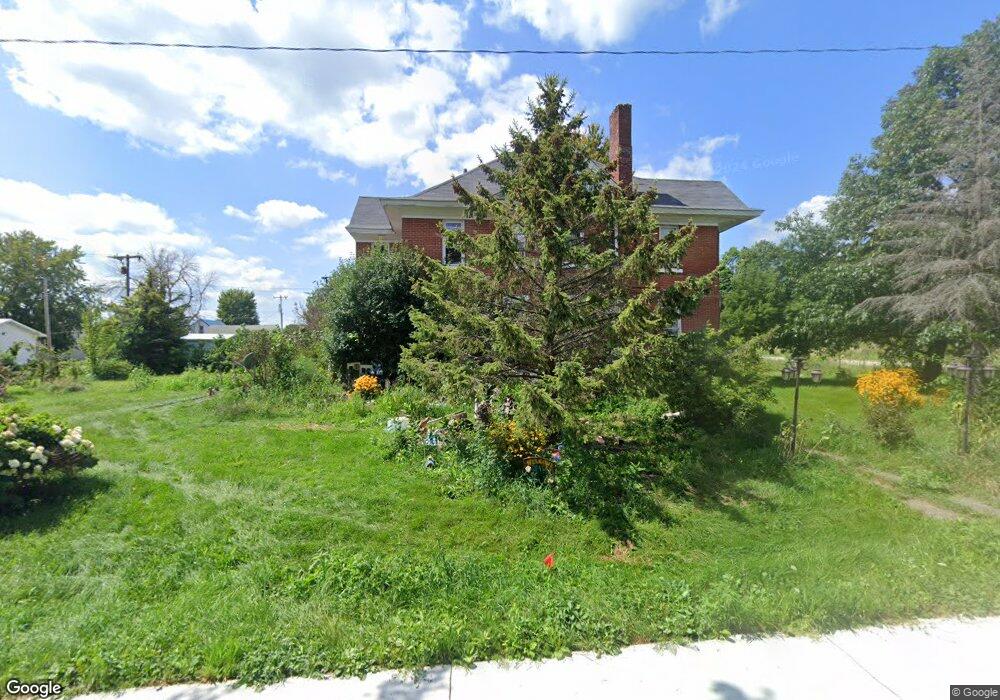
127 N Elm St Stanley, IA 50671
Estimated Value: $79,000 - $244,000
5
Beds
2
Baths
3,208
Sq Ft
$48/Sq Ft
Est. Value
About This Home
This home is located at 127 N Elm St, Stanley, IA 50671 and is currently estimated at $155,481, approximately $48 per square foot. 127 N Elm St is a home located in Buchanan County with nearby schools including Little Husky Learning Center, Wings Park Elementary School, and Parkside Elementary School.
Ownership History
Date
Name
Owned For
Owner Type
Purchase Details
Closed on
Mar 4, 2015
Sold by
Federal Home Loan Mortgage Corporation
Bought by
Bissa Dave and Bissa Cyndy
Current Estimated Value
Purchase Details
Closed on
May 18, 2006
Sold by
Irvine David and Irvine Colleen
Bought by
Delarosa Ricardo
Home Financials for this Owner
Home Financials are based on the most recent Mortgage that was taken out on this home.
Original Mortgage
$76,000
Interest Rate
6.54%
Mortgage Type
New Conventional
Create a Home Valuation Report for This Property
The Home Valuation Report is an in-depth analysis detailing your home's value as well as a comparison with similar homes in the area
Home Values in the Area
Average Home Value in this Area
Purchase History
| Date | Buyer | Sale Price | Title Company |
|---|---|---|---|
| Bissa Dave | -- | None Available | |
| Delarosa Ricardo | $80,000 | None Available |
Source: Public Records
Mortgage History
| Date | Status | Borrower | Loan Amount |
|---|---|---|---|
| Previous Owner | Delarosa Ricardo | $76,000 |
Source: Public Records
Tax History Compared to Growth
Tax History
| Year | Tax Paid | Tax Assessment Tax Assessment Total Assessment is a certain percentage of the fair market value that is determined by local assessors to be the total taxable value of land and additions on the property. | Land | Improvement |
|---|---|---|---|---|
| 2025 | $1,590 | $95,000 | $6,310 | $88,690 |
| 2024 | $1,590 | $76,360 | $5,630 | $70,730 |
| 2023 | $1,560 | $76,360 | $5,630 | $70,730 |
| 2022 | $1,330 | $62,840 | $4,470 | $58,370 |
| 2021 | $1,280 | $62,840 | $4,470 | $58,370 |
| 2020 | $2,852 | $57,750 | $3,990 | $53,760 |
| 2019 | $1,130 | $57,750 | $3,990 | $53,760 |
| 2018 | $1,090 | $49,730 | $3,990 | $45,740 |
| 2017 | $1,170 | $49,730 | $3,990 | $45,740 |
| 2016 | $1,148 | $60,910 | $3,800 | $57,110 |
| 2015 | $1,148 | $60,910 | $3,800 | $57,110 |
| 2014 | $926 | $60,910 | $3,800 | $57,110 |
Source: Public Records
Map
Nearby Homes
- 1894 105th St
- 817 7th St SE
- 1213 Elm St
- 104 Monroe St S
- 207 1st St N
- 1871-8 105th St
- 1871-4 105th St
- 1871-5 105th St
- 1871-3 105th St
- 1871-1 105th St
- 13 Hillside Dr E
- 106 Madison St S
- 5 Hillside Dr E
- 100 Hillside Dr W
- 120 12th Ave NE
- 0 Elmwood Pkwy
- 418 7th Ave SE
- 1108 3rd St NE
- 15542 40th St
- 300 6th Ave SE