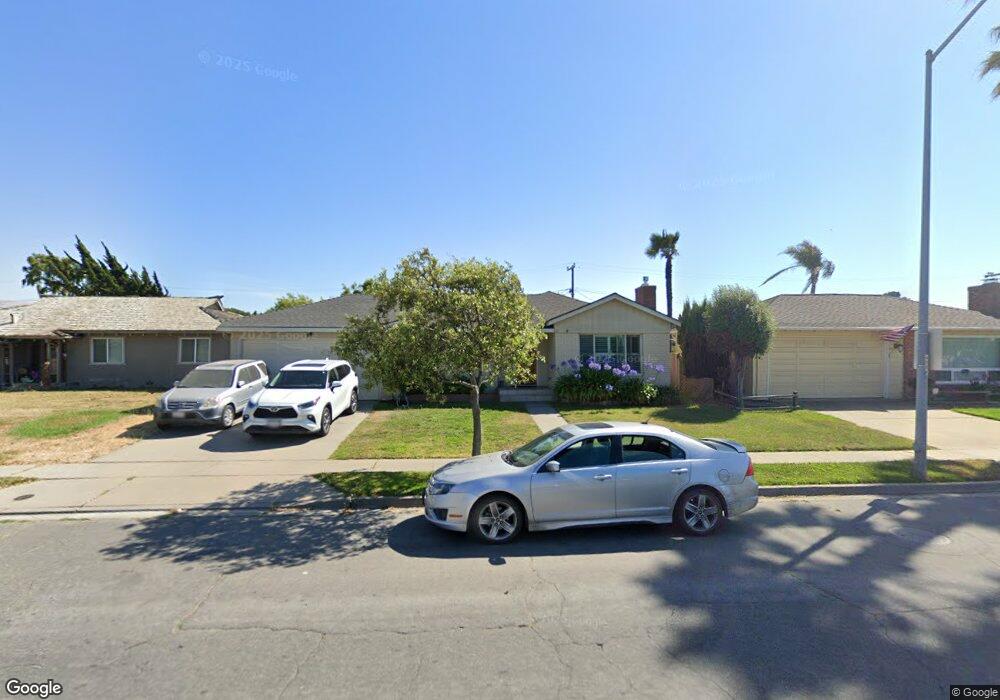
127 Nissen Rd Salinas, CA 93901
South Salinas NeighborhoodEstimated Value: $683,204 - $757,000
3
Beds
2
Baths
1,254
Sq Ft
$577/Sq Ft
Est. Value
About This Home
This home is located at 127 Nissen Rd, Salinas, CA 93901 and is currently estimated at $723,301, approximately $576 per square foot. 127 Nissen Rd is a home located in Monterey County with nearby schools including Monterey Park Elementary School, Lincoln Elementary School, and Mission Park Elementary School.
Ownership History
Date
Name
Owned For
Owner Type
Purchase Details
Closed on
Oct 2, 2012
Sold by
Richardson George E
Bought by
Richardson George E and The George E Richardson Jr Rev
Current Estimated Value
Home Financials for this Owner
Home Financials are based on the most recent Mortgage that was taken out on this home.
Original Mortgage
$208,000
Interest Rate
3.58%
Mortgage Type
New Conventional
Purchase Details
Closed on
Jan 8, 2007
Sold by
Richardson George E and Richardson Rita Ann
Bought by
Revocab Richardson Jr George E and Revocab George E Richardson Jr
Purchase Details
Closed on
Jul 12, 2005
Sold by
Richardson George E and Richardson Rita A
Bought by
Revocab Richardson Jr George E and Revocab George E Richardson Jr
Purchase Details
Closed on
Jul 21, 2000
Sold by
Richardson George E and Richardson Rita Ann
Bought by
Richardson George E and Richardson Rita Ann
Create a Home Valuation Report for This Property
The Home Valuation Report is an in-depth analysis detailing your home's value as well as a comparison with similar homes in the area
Home Values in the Area
Average Home Value in this Area
Purchase History
| Date | Buyer | Sale Price | Title Company |
|---|---|---|---|
| Richardson George E | -- | Chicago Title Company | |
| Richardson George E | -- | Chicago Title Company | |
| Revocab Richardson Jr George E | -- | None Available | |
| Richardson George E | -- | None Available | |
| Revocab Richardson Jr George E | -- | -- | |
| Richardson George E | -- | -- | |
| Richardson George E | -- | -- |
Source: Public Records
Mortgage History
| Date | Status | Borrower | Loan Amount |
|---|---|---|---|
| Closed | Richardson George E | $208,000 |
Source: Public Records
Tax History Compared to Growth
Tax History
| Year | Tax Paid | Tax Assessment Tax Assessment Total Assessment is a certain percentage of the fair market value that is determined by local assessors to be the total taxable value of land and additions on the property. | Land | Improvement |
|---|---|---|---|---|
| 2025 | $2,003 | $172,078 | $42,999 | $129,079 |
| 2024 | $2,003 | $168,705 | $42,156 | $126,549 |
| 2023 | $1,936 | $165,398 | $41,330 | $124,068 |
| 2022 | $1,862 | $162,156 | $40,520 | $121,636 |
| 2021 | $1,790 | $158,977 | $39,726 | $119,251 |
| 2020 | $1,740 | $157,348 | $39,319 | $118,029 |
| 2019 | $1,727 | $154,264 | $38,549 | $115,715 |
| 2018 | $1,703 | $151,241 | $37,794 | $113,447 |
| 2017 | $1,705 | $148,276 | $37,053 | $111,223 |
| 2016 | $1,706 | $145,370 | $36,327 | $109,043 |
| 2015 | $1,638 | $143,188 | $35,782 | $107,406 |
| 2014 | $1,528 | $140,385 | $35,082 | $105,303 |
Source: Public Records
Map
Nearby Homes
- 148 Del Mar Dr
- 138 Nissen Rd
- 1067 Padre Dr Unit 1
- 1051 Riker St Unit 5
- 929 Capistrano Dr
- 330 Woodside Dr Unit 104
- 307 De la Vina Way
- 318 La Jolla Cir
- 50 Katherine Ave
- 1310 Primavera St Unit 118
- 54 Katherine Ave
- 1101 Greenwood Place
- 844 Capistrano Dr
- 40 San Pedro St
- 435 Shelley Way
- 1223 La Canada Way
- 426 Palma Dr
- 255 Katherine Ave
- 121 Oak St
- 35 Willow St
- 135 Nissen Rd
- 123 Nissen Rd
- 36 Del Rey Cir
- 30 Del Rey Cir Unit 2
- 139 Nissen Rd
- 119 Nissen Rd
- 24 Del Rey Cir
- 40 Del Rey Cir
- 143 Nissen Rd
- 102 Nissen Rd
- 102 Nissen Rd Unit 1
- 102 Nissen Rd Unit 2
- 102 Nissen Rd Unit 3
- 100 Nissen Rd Unit 1
- 100 Nissen Rd Unit 1
- 100 Nissen Rd Unit 2
- 100 Nissen Rd Unit 3
- 115 Nissen Rd
- 104 Nissen Rd Unit 1
- 104 Nissen Rd Unit 2