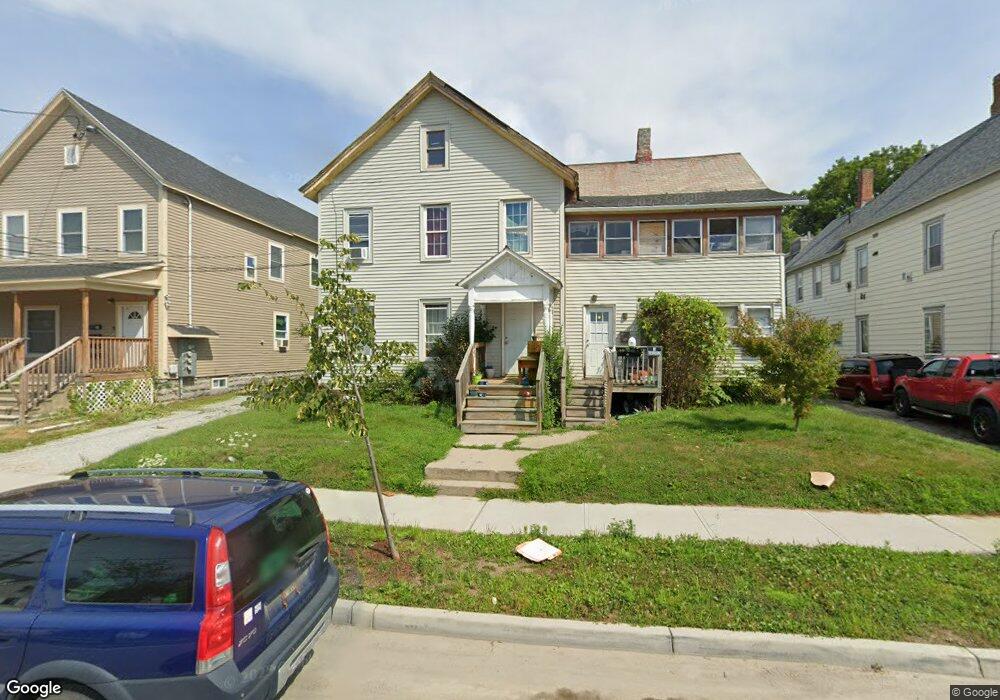
127 Robbins St Rutland, VT 05701
Estimated Value: $117,000 - $202,000
--
Bed
--
Bath
--
Sq Ft
8,712
Sq Ft Lot
About This Home
This home is located at 127 Robbins St, Rutland, VT 05701 and is currently estimated at $164,928. 127 Robbins St is a home located in Rutland County with nearby schools including Rutland Intermediate School, Rutland Middle School, and Rutland Senior High School.
Ownership History
Date
Name
Owned For
Owner Type
Purchase Details
Closed on
Jan 31, 2022
Sold by
Wrvt001 Trust
Bought by
Nutbrown Melissa and Nutbrown Travis
Current Estimated Value
Purchase Details
Closed on
Aug 30, 2021
Sold by
Westside Rutland Inc
Purchase Details
Closed on
May 5, 2011
Sold by
Girardi Joseph
Bought by
Girardi Rina L
Purchase Details
Closed on
Apr 19, 2005
Sold by
Girardi Joseph and Giraradi Anna Rita
Bought by
Westide Rutland Inc
Purchase Details
Closed on
Oct 30, 1997
Sold by
Horvath Christopher and Horvath Pamela
Bought by
Girardi Joseph and Girardi Anna Rita
Create a Home Valuation Report for This Property
The Home Valuation Report is an in-depth analysis detailing your home's value as well as a comparison with similar homes in the area
Home Values in the Area
Average Home Value in this Area
Purchase History
| Date | Buyer | Sale Price | Title Company |
|---|---|---|---|
| Nutbrown Melissa | $97,000 | -- | |
| Nutbrown Melissa | $97,000 | -- | |
| -- | $50,000 | -- | |
| Westide Rutland Inc | -- | -- | |
| Westide Rutland Inc | -- | -- | |
| Girardi Joseph | $17,000 | -- | |
| Girardi Joseph | $17,000 | -- | |
| Girardi Rina L | $72,000 | -- |
Source: Public Records
Mortgage History
| Date | Status | Borrower | Loan Amount |
|---|---|---|---|
| Closed | Girardi Rina L | $0 |
Source: Public Records
Tax History Compared to Growth
Tax History
| Year | Tax Paid | Tax Assessment Tax Assessment Total Assessment is a certain percentage of the fair market value that is determined by local assessors to be the total taxable value of land and additions on the property. | Land | Improvement |
|---|---|---|---|---|
| 2024 | -- | $89,000 | $40,800 | $48,200 |
| 2023 | -- | $89,000 | $40,800 | $48,200 |
| 2022 | $3,073 | $89,000 | $40,800 | $48,200 |
| 2021 | $3,112 | $89,000 | $40,800 | $48,200 |
| 2020 | $3,084 | $89,000 | $40,800 | $48,200 |
| 2019 | $3,008 | $89,000 | $40,800 | $48,200 |
| 2018 | $2,978 | $88,000 | $40,800 | $47,200 |
| 2017 | $2,704 | $134,400 | $40,800 | $93,600 |
| 2016 | $2,708 | $88,000 | $40,800 | $47,200 |
Source: Public Records
Map
Nearby Homes