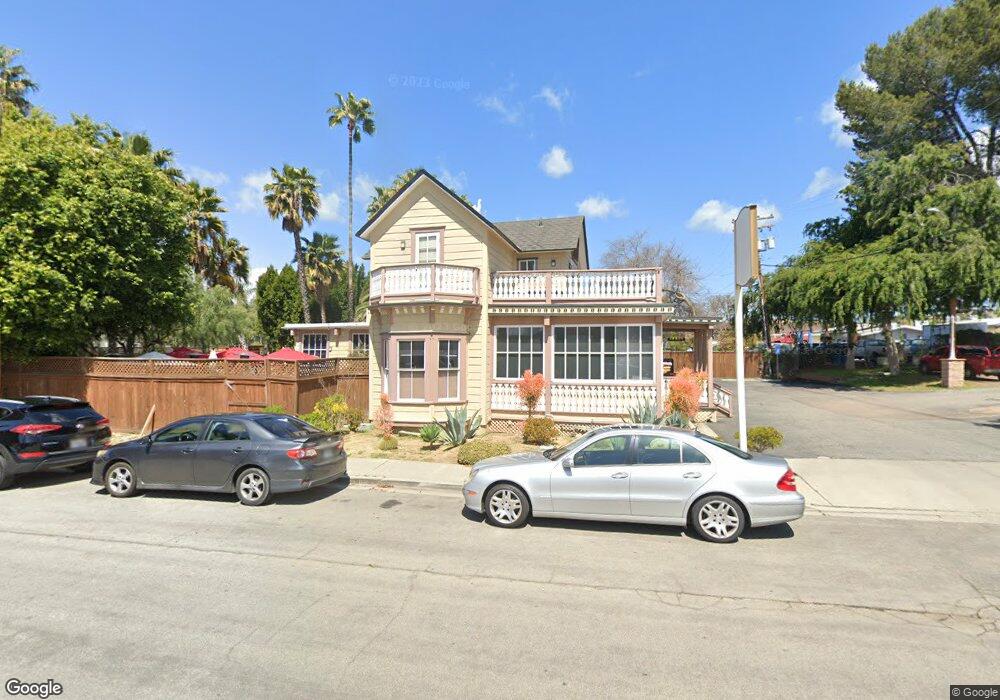
127 W Elder St Fallbrook, CA 92028
Studio
--
Bath
2,668
Sq Ft
7,187
Sq Ft Lot
About This Home
This home is located at 127 W Elder St, Fallbrook, CA 92028. 127 W Elder St is a home located in San Diego County with nearby schools including Fallbrook STEM Academy, James E. Potter Intermediate School, and Fallbrook High School.
Ownership History
Date
Name
Owned For
Owner Type
Purchase Details
Closed on
Jul 30, 2012
Sold by
Reeder Charles A and Reeder Julie A
Bought by
Moosa Adil and Moosa Araxy
Purchase Details
Closed on
May 27, 2005
Sold by
El Bo Llc
Bought by
Reeder Charles A and Reeder Julie A
Home Financials for this Owner
Home Financials are based on the most recent Mortgage that was taken out on this home.
Original Mortgage
$685,000
Interest Rate
5.74%
Mortgage Type
Commercial
Purchase Details
Closed on
Oct 21, 2003
Sold by
Fallbrook Country Day School
Bought by
El Bo Llc
Home Financials for this Owner
Home Financials are based on the most recent Mortgage that was taken out on this home.
Original Mortgage
$360,000
Interest Rate
5.98%
Mortgage Type
Commercial
Create a Home Valuation Report for This Property
The Home Valuation Report is an in-depth analysis detailing your home's value as well as a comparison with similar homes in the area
Home Values in the Area
Average Home Value in this Area
Purchase History
| Date | Buyer | Sale Price | Title Company |
|---|---|---|---|
| Moosa Adil | $450,000 | Lawyers Title Insurance Co | |
| Reeder Charles A | $725,000 | Commonwealth Title | |
| El Bo Llc | $450,000 | First American Title |
Source: Public Records
Mortgage History
| Date | Status | Borrower | Loan Amount |
|---|---|---|---|
| Previous Owner | Reeder Charles A | $685,000 | |
| Previous Owner | El Bo Llc | $360,000 |
Source: Public Records
Tax History
| Year | Tax Paid | Tax Assessment Tax Assessment Total Assessment is a certain percentage of the fair market value that is determined by local assessors to be the total taxable value of land and additions on the property. | Land | Improvement |
|---|---|---|---|---|
| 2025 | $2,741 | $438,600 | $132,600 | $306,000 |
| 2024 | $2,741 | $253,516 | $90,540 | $162,976 |
| 2023 | $2,668 | $248,546 | $88,765 | $159,781 |
| 2022 | $2,662 | $243,674 | $87,025 | $156,649 |
| 2021 | $2,582 | $238,897 | $85,319 | $153,578 |
| 2020 | $2,607 | $236,449 | $84,445 | $152,004 |
| 2019 | $2,562 | $231,814 | $82,790 | $149,024 |
| 2018 | $2,524 | $227,269 | $81,167 | $146,102 |
| 2017 | $2,475 | $222,814 | $79,576 | $143,238 |
| 2016 | $2,492 | $218,446 | $78,016 | $140,430 |
| 2015 | $2,402 | $215,166 | $76,845 | $138,321 |
| 2014 | $2,358 | $210,952 | $75,340 | $135,612 |
Source: Public Records
Map
Nearby Homes
- 522 S Pico Ave
- 210 S Orange Ave
- 502 E Elder St
- 214 Summit Ave
- 408 N Pico Ave
- 0 Via Vonnie Unit SW26054903
- 508 Village View Place
- 741 Rossiter Ln
- 1024 Kiel Rd
- 535 Shady Glen Dr
- 678 Robby Way
- 275 Royal Glen Dr
- 868 E Alvarado St Unit 7
- 868 E Alvarado St Unit 47
- 842 Porter Way
- 1006 N Orange Ave
- 206 Via Oro Verde
- 113 Gardenside Ct
- 445 Poets Square
- 956 Woodcreek Rd
- 128 W Elder St
- 214 S Pico Ave
- 134 W Elder St Unit 40
- 0 Pico Ave Unit 10 190060357
- S Main
- 309 S Main Ave Unit B
- 309 S Main Ave Unit 21
- 213 W Elder St
- 232 S Main Ave
- 331 S Main Ave
- 127 W Fig St Unit 1
- 312 S Main Ave
- 225 W Elder St
- 339 S Main Ave
- 212 N Mission Rd
- 138 S Main Ave
- 136 E Elder St
- 225 S Vine St
- 112 W College St
- 112-16 112-16 W College
Your Personal Tour Guide
Ask me questions while you tour the home.