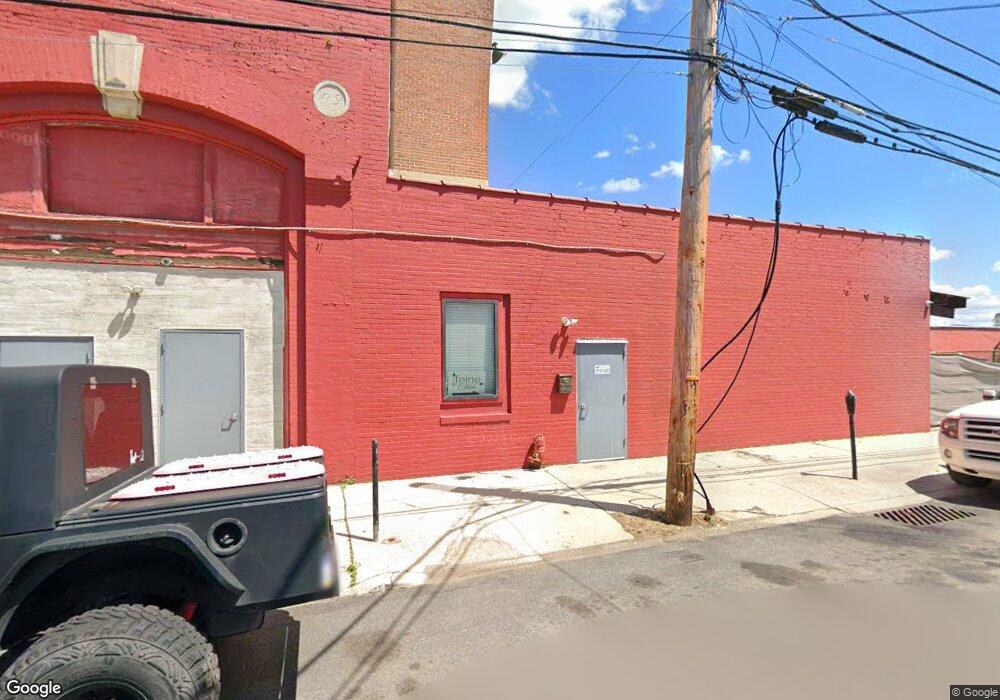
127 W Front St Bridge Port, PA 19405
--
Bed
--
Bath
64,098
Sq Ft
0.84
Acres
About This Home
This home is located at 127 W Front St, Bridge Port, PA 19405. 127 W Front St is a home located in Montgomery County with nearby schools including Bridgeport Elementary School, Upper Merion Middle School, and Upper Merion High School.
Ownership History
Date
Name
Owned For
Owner Type
Purchase Details
Closed on
Oct 2, 2013
Sold by
Renard Corporation and Nelson Eugene
Bought by
3 Dekalb Associates Lp
Home Financials for this Owner
Home Financials are based on the most recent Mortgage that was taken out on this home.
Original Mortgage
$850,000
Outstanding Balance
$639,454
Interest Rate
4.53%
Mortgage Type
Future Advance Clause Open End Mortgage
Purchase Details
Closed on
Oct 13, 1995
Sold by
Montgomery County Industrial Development
Bought by
Renart Corp
Purchase Details
Closed on
Sep 21, 1994
Sold by
Montgomery County Industrial Development
Bought by
Renart Corp
Create a Home Valuation Report for This Property
The Home Valuation Report is an in-depth analysis detailing your home's value as well as a comparison with similar homes in the area
Home Values in the Area
Average Home Value in this Area
Purchase History
| Date | Buyer | Sale Price | Title Company |
|---|---|---|---|
| 3 Dekalb Associates Lp | $1,200,000 | None Available | |
| Renart Corp | -- | -- | |
| Renart Corp | -- | -- |
Source: Public Records
Mortgage History
| Date | Status | Borrower | Loan Amount |
|---|---|---|---|
| Open | 3 Dekalb Associates Lp | $850,000 |
Source: Public Records
Tax History Compared to Growth
Tax History
| Year | Tax Paid | Tax Assessment Tax Assessment Total Assessment is a certain percentage of the fair market value that is determined by local assessors to be the total taxable value of land and additions on the property. | Land | Improvement |
|---|---|---|---|---|
| 2025 | $24,716 | $627,170 | -- | -- |
| 2024 | $24,716 | $627,170 | -- | -- |
| 2023 | $24,031 | $627,170 | $0 | $0 |
| 2022 | $23,395 | $627,170 | $0 | $0 |
| 2021 | $23,213 | $627,170 | $0 | $0 |
| 2020 | $22,841 | $627,170 | $0 | $0 |
| 2019 | $22,559 | $627,170 | $0 | $0 |
| 2018 | $22,558 | $627,170 | $0 | $0 |
| 2017 | $21,975 | $627,170 | $0 | $0 |
| 2016 | $21,730 | $550,390 | $141,060 | $409,330 |
| 2015 | $18,571 | $550,390 | $141,060 | $409,330 |
| 2014 | $18,571 | $550,390 | $141,060 | $409,330 |
Source: Public Records
Map
Nearby Homes
- 122 2nd St
- 46 W Front St
- 39 W Front St
- 34 2nd St
- 29 2nd St
- 103 W 3rd St
- 23 E Front St
- 57 E Front St
- 45 E Front St
- Cambridge Plan at River Pointe - Cambridge Townhomes
- Cambridge Luxe Plan at River Pointe - Cambridge Townhomes
- 78 W Rambo St
- 33 Anderson Dr
- 27 Atkins Dr
- 21 Atkins Dr
- 64 W 5th St
- 19 E Front St
- 601 Green St
- 607 Dekalb St
- 615 Green St