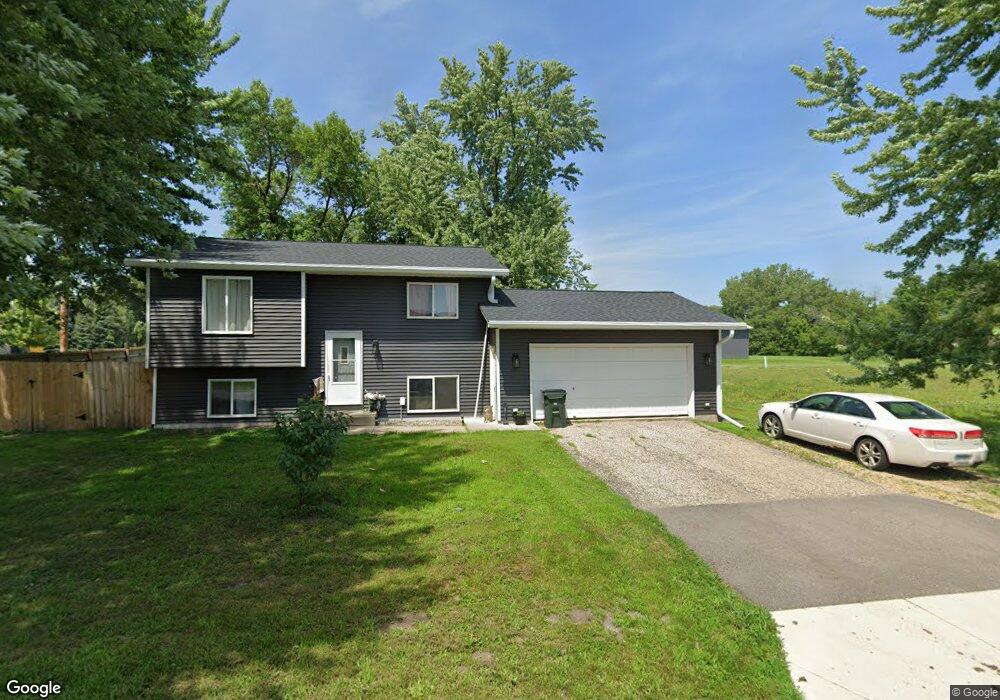
1270 Lewis Ln Elysian, MN 56028
Estimated Value: $208,000 - $261,000
3
Beds
2
Baths
842
Sq Ft
$289/Sq Ft
Est. Value
About This Home
This home is located at 1270 Lewis Ln, Elysian, MN 56028 and is currently estimated at $242,936, approximately $288 per square foot. 1270 Lewis Ln is a home located in Le Sueur County with nearby schools including Waterville Elementary School, Morristown Elementary School, and Waterville-Elysian-Morristown Junior High School.
Ownership History
Date
Name
Owned For
Owner Type
Purchase Details
Closed on
May 3, 2017
Sold by
Schroer Sally
Bought by
Kline Jake
Current Estimated Value
Home Financials for this Owner
Home Financials are based on the most recent Mortgage that was taken out on this home.
Original Mortgage
$154,545
Outstanding Balance
$128,979
Interest Rate
4.23%
Mortgage Type
Purchase Money Mortgage
Estimated Equity
$113,957
Purchase Details
Closed on
Apr 28, 2017
Sold by
Sally Schroer
Bought by
Kline Jake
Home Financials for this Owner
Home Financials are based on the most recent Mortgage that was taken out on this home.
Original Mortgage
$154,545
Outstanding Balance
$128,979
Interest Rate
4.23%
Mortgage Type
Purchase Money Mortgage
Estimated Equity
$113,957
Purchase Details
Closed on
Sep 4, 2007
Sold by
Mulder Mckenzie A and Mulder Jay J
Bought by
Schroer Sally
Create a Home Valuation Report for This Property
The Home Valuation Report is an in-depth analysis detailing your home's value as well as a comparison with similar homes in the area
Purchase History
| Date | Buyer | Sale Price | Title Company |
|---|---|---|---|
| Kline Jake | $153,000 | -- | |
| Kline Jake | $153,000 | -- | |
| Schroer Sally | $141,500 | -- |
Source: Public Records
Mortgage History
| Date | Status | Borrower | Loan Amount |
|---|---|---|---|
| Open | Kline Jake | $154,545 |
Source: Public Records
Tax History
| Year | Tax Paid | Tax Assessment Tax Assessment Total Assessment is a certain percentage of the fair market value that is determined by local assessors to be the total taxable value of land and additions on the property. | Land | Improvement |
|---|---|---|---|---|
| 2025 | $3,390 | $199,900 | $43,300 | $156,600 |
| 2024 | $3,342 | $191,300 | $43,300 | $148,000 |
| 2023 | $2,288 | $186,400 | $43,300 | $143,100 |
| 2022 | $1,970 | $185,400 | $43,300 | $142,100 |
| 2021 | $1,936 | $143,900 | $38,300 | $105,600 |
| 2020 | $1,946 | $138,000 | $36,300 | $101,700 |
| 2019 | $2,010 | $113,200 | $29,777 | $83,423 |
| 2018 | $1,995 | $113,200 | $29,777 | $83,423 |
| 2017 | $1,441 | $91,200 | $23,458 | $67,742 |
| 2016 | $1,504 | $89,900 | $23,362 | $66,538 |
| 2015 | $1,489 | $94,400 | $23,678 | $70,722 |
| 2014 | $1,397 | $100,100 | $24,072 | $76,028 |
| 2013 | $1,324 | $90,800 | $23,415 | $67,385 |
Source: Public Records
Map
Nearby Homes
- 0 Xx Lewis Ln Unit 7025397
- 0 Xx Lewis Ln Unit 7025381
- xx Lewis Ln
- xxxxxx Lewis Ln
- -XX Jason Dr
- 121 Willow Point Dr
- 125 Willow Point Dr
- 2 Marie Cir
- 3271 425th Ave
- 49279 Sportsmans Ln
- 49189 Sportsmans Ln
- 20232 Tetonka Lake Rd
- 48901 N Shore Rd
- 0 N Shore Rd
- 16965 Dickenson Ln
- 725 Northwood Dr
- 605 Northwood Place
- 921 Lillian St
- E North St
- 714 N Teal St
- xxx Lot 2 Lewis Ln
- xxx Lot 2 Lewis Lane St
- xxx Lot 6 Lewis Ln
- 0 Xxx Lewis Ln
- 206 5th St SW
- 206 NW 5th St
- 206 SW 5th St
- 209 5th St SW
- 1277 Lewis Ln
- 0 Part of Block22 5th St
- 1276 Lewis Ln
- 207 207 Sw 5th St Unit 207 5th St SW
- 207 5th St SW
- xxx Lot 3 Lewis Ln
- XXX Lot 3 Lewis Lane St
- XXXX Lewis Ln
- xxx Lot 4 Lewis Ln
- 7260 7260 435th-Avenue-
- 7260 7260 435th Ave
- 7260 435th Ave
Your Personal Tour Guide
Ask me questions while you tour the home.