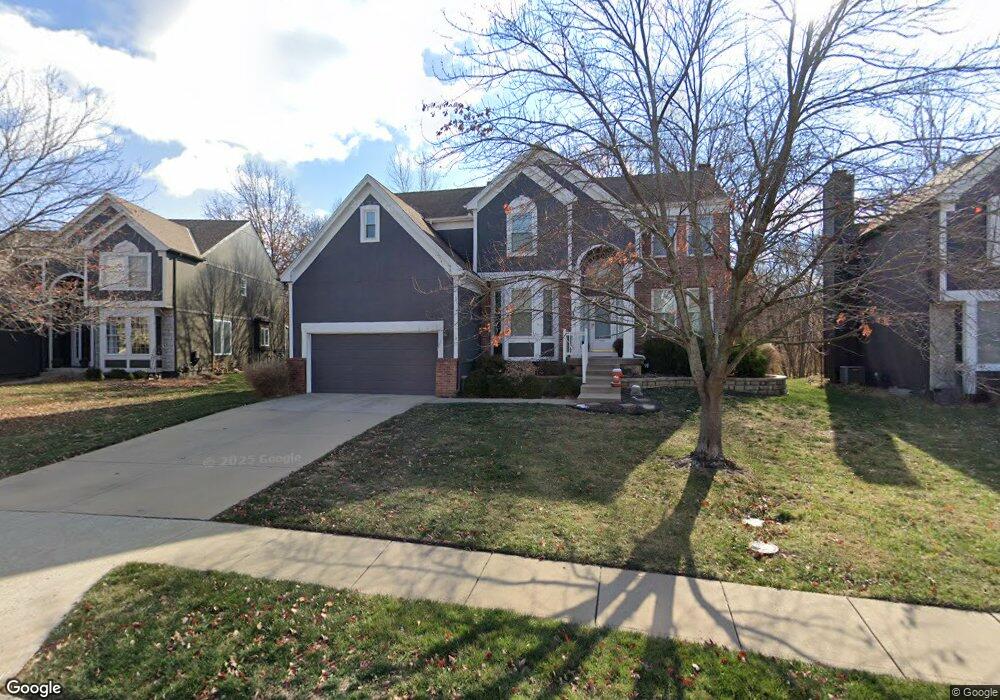
12709 W 125th St Overland Park, KS 66213
Nottingham NeighborhoodEstimated Value: $541,431 - $617,000
4
Beds
5
Baths
2,631
Sq Ft
$217/Sq Ft
Est. Value
About This Home
This home is located at 12709 W 125th St, Overland Park, KS 66213 and is currently estimated at $569,858, approximately $216 per square foot. 12709 W 125th St is a home located in Johnson County with nearby schools including Pleasant Ridge Elementary School, California Trail Middle School, and Olathe East Sr High School.
Ownership History
Date
Name
Owned For
Owner Type
Purchase Details
Closed on
May 7, 2014
Sold by
Hickman Michael B and Hickman Elizabeth W
Bought by
Brown Rebekah L
Current Estimated Value
Home Financials for this Owner
Home Financials are based on the most recent Mortgage that was taken out on this home.
Original Mortgage
$220,020
Outstanding Balance
$64,960
Interest Rate
3.53%
Mortgage Type
New Conventional
Estimated Equity
$504,898
Purchase Details
Closed on
Mar 6, 2009
Sold by
Hickman Michael and Hickman Elizabeth W
Bought by
Hickman Michael B and Hickman Elizabeth W
Home Financials for this Owner
Home Financials are based on the most recent Mortgage that was taken out on this home.
Original Mortgage
$212,500
Interest Rate
5.06%
Mortgage Type
New Conventional
Purchase Details
Closed on
Jan 28, 2002
Sold by
Hickman Michael B and Hickman Elizabeth W
Bought by
Hickman Michael B and Hickman Elizabeth W
Create a Home Valuation Report for This Property
The Home Valuation Report is an in-depth analysis detailing your home's value as well as a comparison with similar homes in the area
Home Values in the Area
Average Home Value in this Area
Purchase History
| Date | Buyer | Sale Price | Title Company |
|---|---|---|---|
| Brown Rebekah L | -- | First American Title | |
| Hickman Michael B | -- | First American Title Ins Co | |
| Hickman Michael | -- | First American Title Ins Co | |
| Hickman Michael B | -- | -- |
Source: Public Records
Mortgage History
| Date | Status | Borrower | Loan Amount |
|---|---|---|---|
| Open | Brown Rebekah L | $220,020 | |
| Previous Owner | Hickman Michael | $212,500 |
Source: Public Records
Tax History Compared to Growth
Tax History
| Year | Tax Paid | Tax Assessment Tax Assessment Total Assessment is a certain percentage of the fair market value that is determined by local assessors to be the total taxable value of land and additions on the property. | Land | Improvement |
|---|---|---|---|---|
| 2024 | $6,132 | $56,178 | $11,374 | $44,804 |
| 2023 | $5,819 | $52,475 | $11,374 | $41,101 |
| 2022 | $5,104 | $45,081 | $11,374 | $33,707 |
| 2021 | $5,181 | $43,608 | $10,345 | $33,263 |
| 2020 | $4,909 | $41,285 | $8,622 | $32,663 |
| 2019 | $4,757 | $39,722 | $5,762 | $33,960 |
| 2018 | $4,626 | $38,330 | $5,762 | $32,568 |
| 2017 | $4,535 | $37,272 | $5,762 | $31,510 |
| 2016 | $4,100 | $34,547 | $5,762 | $28,785 |
| 2015 | $3,811 | $32,431 | $5,762 | $26,669 |
| 2013 | -- | $31,867 | $5,762 | $26,105 |
Source: Public Records
Map
Nearby Homes
- 12704 W 124th St
- 13406 W 126th Place
- 13007 W 123rd Terrace
- 12707 W 122nd St
- 12522 W 123rd Terrace
- 12715 S Rene St
- 12104 Oakmont St
- 12131 S Rene St
- 11918 Westgate St
- 13654 W 129th St
- 11915 Westgate St
- 12406 W 129th St
- 13641 W 129th St
- 12909 W 129th St
- 13404 W 130th St
- 11812 Gillette St
- 12908 W 118th Terrace
- 13604 W 129th Terrace
- 13981 W 120th St
- 12201 W 129th Terrace
- 12713 W 125th St
- 12801 W 125th St
- 12701 W 125th St
- 12704 W 125th St
- 12708 W 125th St
- 12805 W 125th St
- 12467 Rosehill St
- 12462 Rosehill St
- 12802 W 125th St
- 12455 Parkhill St
- 12809 W 125th St
- 12458 Rosehill St
- 12806 W 125th St
- 12463 Rosehill St
- 12460 Parkhill St
- 12901 W 125th St
- 12459 Rosehill St
- 12454 Rosehill St
- 12451 Parkhill St
- 12900 W 125th St