
Seller's Agent in 2026
Cory Meyer
eXp Realty of Northern California, Inc.
(530) 410-6011
6 in this area
589 Total Sales


Estimated Value: $339,000 - $379,000
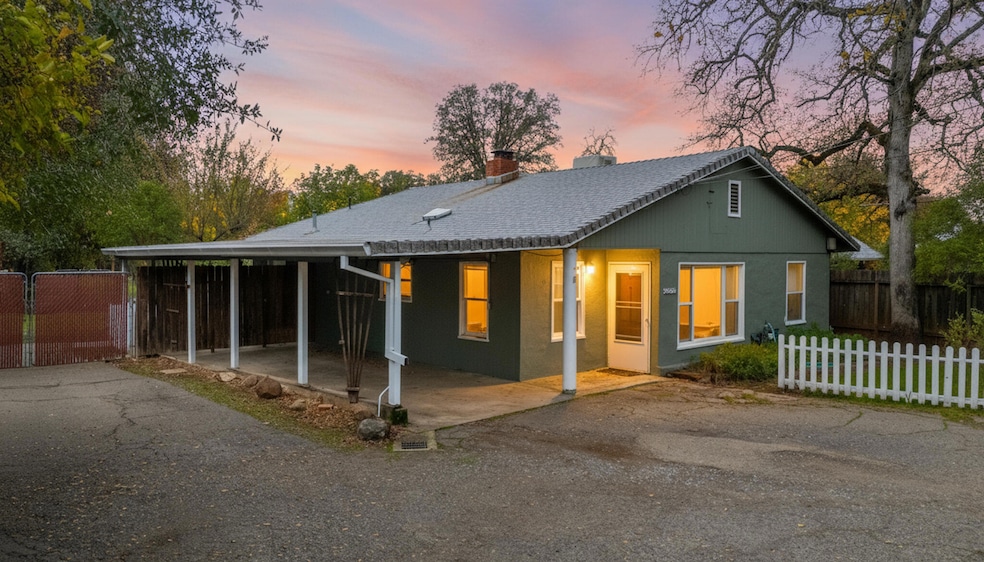
Rare property alert! This charming 3 bedroom, 2 bath home sits on a full acre of flat, usable land, nearly impossible to find inside city limits in this price point. Enjoy ultimate privacy and space while being steps from Mistletoe Elementary School and minutes from shopping, dining, and quick highway access. The pull through circular driveway offers easy entry and exit, perfect for trailers, boats, or extra vehicles, and leads straight to a oversized detached SHOP ready for hobbies, storage, or a home business and with 8' wide x approximately 28' long x 5'9' high with plywood floor in the attic space, there is extra room! Access door is above porch roof. Move in ready with room to grow, this property combines small town feel with big city convenience. Host epic barbecues on your sprawling property, park all your toys with ease, and still walk the kids to school. Properties like this don't hit the market often!
Last Agent to Sell the Property
eXp Realty of Northern California, Inc. License #01715789 Listed on: 11/20/2025
We collect this data history from publicly available records. To have your information removed, we recommend requesting removal directly through your county’s website.
| Date | Buyer | Sale Price | Title Company |
|---|---|---|---|
| Rivera Tyler D | $365,000 | First American Title | |
| Engell Charles W | -- | None Available | |
| Engell Charles W | -- | None Available | |
| Engell Charles W | $290,000 | First American Title Co | |
| Engell Charles W | -- | First American Title Co |
We collect this data history from publicly available records. To have your information removed, we recommend requesting removal directly through your county’s website.
| Date | Status | Borrower | Loan Amount |
|---|---|---|---|
| Open | Rivera Tyler D | $365,000 | |
| Previous Owner | Engell Charles W | $203,000 | |
| Previous Owner | Engell Charles W | $75,000 | |
| Closed | Engell Charles W | $10,000 |
| Date | Event | Price | List to Sale | Price per Sq Ft |
|---|---|---|---|---|
| 01/23/2026 01/23/26 | Sold | $365,000 | 0.0% | $328 / Sq Ft |
| 12/19/2025 12/19/25 | Pending | -- | -- | -- |
| 11/20/2025 11/20/25 | For Sale | $365,000 | -- | $328 / Sq Ft |
| Year | Tax Paid | Tax Assessment Tax Assessment Total Assessment is a certain percentage of the fair market value that is determined by local assessors to be the total taxable value of land and additions on the property. | Land | Improvement |
|---|---|---|---|---|
| 2025 | $1,527 | $138,567 | $51,991 | $86,576 |
| 2024 | $1,506 | $135,851 | $50,972 | $84,879 |
| 2023 | $1,506 | $133,188 | $49,973 | $83,215 |
| 2022 | $1,463 | $130,578 | $48,994 | $81,584 |
| 2021 | $1,413 | $128,019 | $48,034 | $79,985 |
| 2020 | $1,407 | $126,707 | $47,542 | $79,165 |
| 2019 | $1,396 | $124,223 | $46,610 | $77,613 |
| 2018 | $1,379 | $121,789 | $45,697 | $76,092 |
| 2017 | $1,403 | $119,401 | $44,801 | $74,600 |
| 2016 | $1,313 | $117,061 | $43,923 | $73,138 |
| 2015 | $1,302 | $115,304 | $43,264 | $72,040 |
| 2014 | $1,293 | $113,046 | $42,417 | $70,629 |
Seller's Agent in 2026
Cory Meyer
eXp Realty of Northern California, Inc.
(530) 410-6011
6 in this area
589 Total Sales
Seller Co-Listing Agent in 2026
Sandy Duggan
eXp Realty of Northern California, Inc.
(530) 209-6539
1 in this area
190 Total Sales
Buyer's Agent in 2026
Clinton Cronic
eXp Realty of California, Inc.
(530) 227-0345
1 in this area
60 Total Sales
Source: Shasta Association of REALTORS®
MLS Number: 25-5121
APN: 067-090-047-000
Disclaimer: Certain information contained herein is derived from information provided by parties other than Homes.com. All information provided is deemed reliable, but is not guaranteed to be accurate and should be independently verified.
![]() IDX information is provided exclusively for personal, non-commercial use, and may not be used for any purpose other than to identify prospective properties consumers may be interested in purchasing. Information is deemed reliable but not guaranteed.
IDX information is provided exclusively for personal, non-commercial use, and may not be used for any purpose other than to identify prospective properties consumers may be interested in purchasing. Information is deemed reliable but not guaranteed.
Ask me questions while you tour the home.