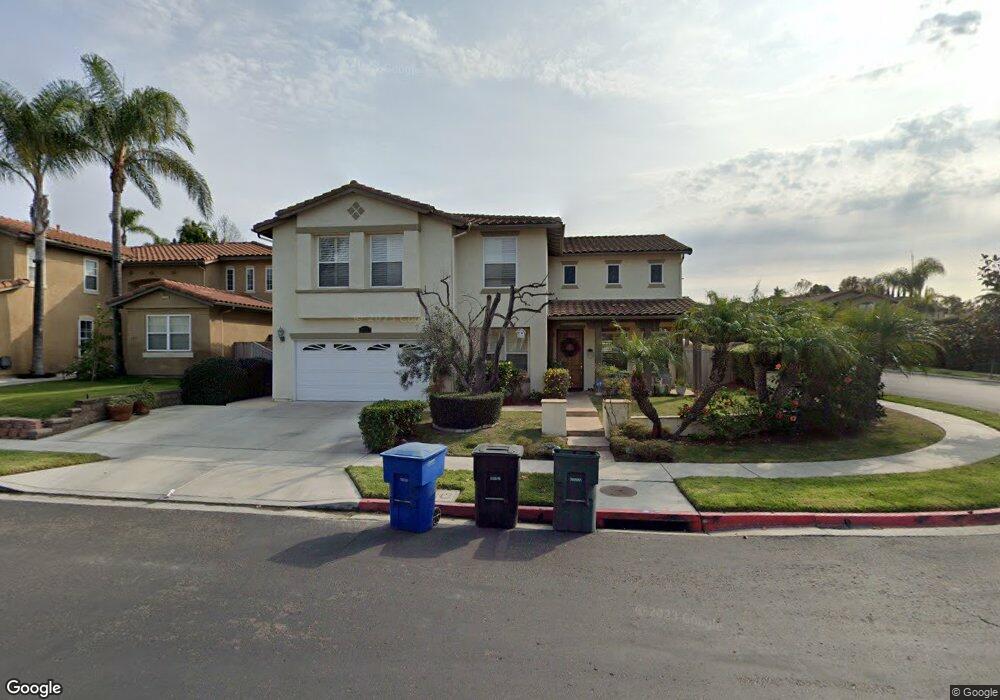
1271 Wheatland St Chula Vista, CA 91913
Otay Ranch Village NeighborhoodEstimated Value: $1,341,744 - $1,355,000
5
Beds
5
Baths
3,625
Sq Ft
$373/Sq Ft
Est. Value
About This Home
This home is located at 1271 Wheatland St, Chula Vista, CA 91913 and is currently estimated at $1,350,686, approximately $372 per square foot. 1271 Wheatland St is a home located in San Diego County with nearby schools including Heritage Elementary School, Rancho Del Rey Middle School, and Otay Ranch Senior High School.
Ownership History
Date
Name
Owned For
Owner Type
Purchase Details
Closed on
Mar 17, 2023
Sold by
Kohnen Alexander M
Bought by
Kohnen Kelley B
Current Estimated Value
Purchase Details
Closed on
May 22, 2010
Sold by
Sands Lawrence K and Sands Karen L
Bought by
Kohnen Alexander M and Kohnen Kelley B
Home Financials for this Owner
Home Financials are based on the most recent Mortgage that was taken out on this home.
Original Mortgage
$410,400
Interest Rate
5.05%
Mortgage Type
New Conventional
Purchase Details
Closed on
Nov 17, 2000
Sold by
Shea Homes Ltd Partnership
Bought by
Sands Lawrence K and Sands Karen L
Home Financials for this Owner
Home Financials are based on the most recent Mortgage that was taken out on this home.
Original Mortgage
$357,450
Interest Rate
7.86%
Create a Home Valuation Report for This Property
The Home Valuation Report is an in-depth analysis detailing your home's value as well as a comparison with similar homes in the area
Home Values in the Area
Average Home Value in this Area
Purchase History
| Date | Buyer | Sale Price | Title Company |
|---|---|---|---|
| Kohnen Kelley B | -- | -- | |
| Kohnen Alexander M | $513,000 | Fidelity National Title | |
| Sands Lawrence K | $477,000 | First American Title |
Source: Public Records
Mortgage History
| Date | Status | Borrower | Loan Amount |
|---|---|---|---|
| Previous Owner | Kohnen Alexander M | $410,400 | |
| Previous Owner | Sands Lawrence K | $357,450 |
Source: Public Records
Tax History Compared to Growth
Tax History
| Year | Tax Paid | Tax Assessment Tax Assessment Total Assessment is a certain percentage of the fair market value that is determined by local assessors to be the total taxable value of land and additions on the property. | Land | Improvement |
|---|---|---|---|---|
| 2025 | $12,321 | $662,171 | $232,337 | $429,834 |
| 2024 | $12,321 | $649,188 | $227,782 | $421,406 |
| 2023 | $12,101 | $623,982 | $218,938 | $405,044 |
| 2022 | $11,765 | $623,982 | $218,938 | $405,044 |
| 2021 | $11,525 | $611,748 | $214,646 | $397,102 |
| 2020 | $11,268 | $605,477 | $212,446 | $393,031 |
| 2019 | $10,995 | $593,606 | $208,281 | $385,325 |
| 2018 | $10,797 | $581,968 | $204,198 | $377,770 |
| 2017 | $10,585 | $570,558 | $200,195 | $370,363 |
| 2016 | $10,205 | $559,371 | $196,270 | $363,101 |
| 2015 | $9,917 | $550,969 | $193,322 | $357,647 |
| 2014 | $9,627 | $540,178 | $189,536 | $350,642 |
Source: Public Records
Map
Nearby Homes
- 1340 Monte Sereno Ave
- 1175 Santa Olivia Rd
- 1209 Morgan Hill Dr
- 1377 Stoney Spring Ct
- 1236 El Cortez Ct
- 1156 Tristan River Rd
- 1181 De Soto Ct Unit 54
- 1284 Saint Helena Ave
- 1060 Via Sinuoso
- 1075 Hayuco Plaza
- 1402 Antioch Ave
- 1057 Paseo Del Norte
- 1337 Santa Olivia Rd
- 1124 Sparrow Lake Rd
- 1411 Santa Rita E
- 1112 Camino Del Rey
- 1236 Bolinas Bay Ct
- 1532 Painted Cave Ave
- 1029 Vista Oak Place
- 843 Calle Ciela Vista Unit 20
- 1275 Wheatland St
- 1279 Wheatland St
- 1278 Vernon Ct
- 1272 Calpella Ct
- 1276 Calpella Ct
- 1270 Wheatland St
- 1274 Wheatland St
- 1262 Wheatland St
- 1283 Wheatland St
- 1274 Vernon Ct
- 1266 Wheatland St
- 1279 Vernon Ct
- 1280 Calpella Ct
- 1278 Wheatland St
- 1275 Vernon Ct
- 1287 Wheatland St
- 1282 Wheatland St
- 1284 Calpella Ct
- 1271 Vernon Ct
- 1286 Wheatland St