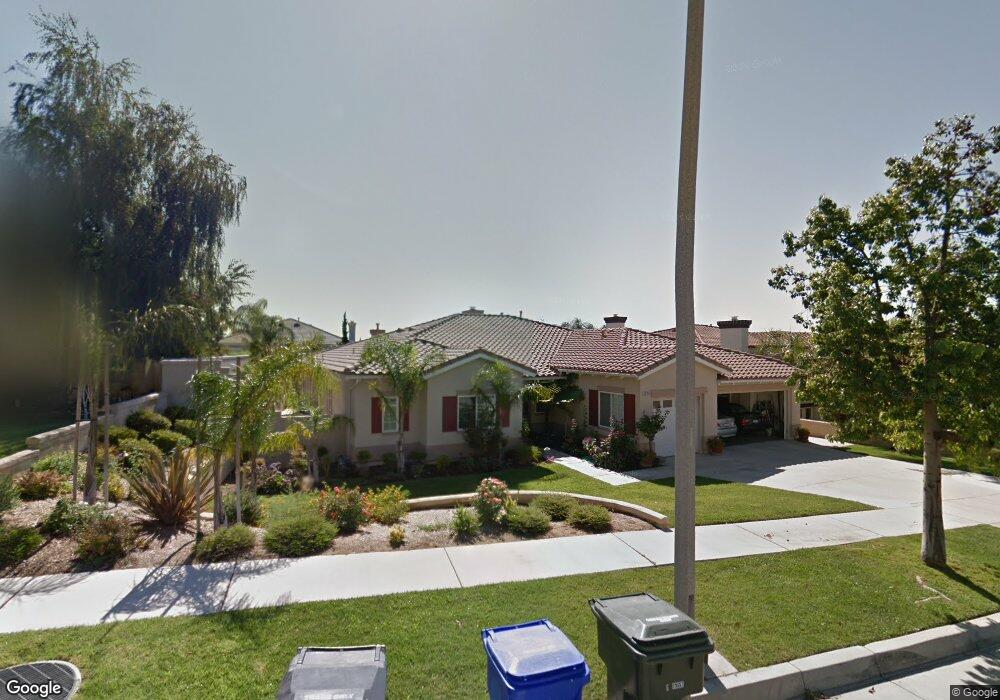
12711 N Overlook Dr Rancho Cucamonga, CA 91739
Etiwanda NeighborhoodEstimated Value: $1,178,536 - $1,320,000
4
Beds
3
Baths
3,000
Sq Ft
$417/Sq Ft
Est. Value
About This Home
This home is located at 12711 N Overlook Dr, Rancho Cucamonga, CA 91739 and is currently estimated at $1,249,634, approximately $416 per square foot. 12711 N Overlook Dr is a home located in San Bernardino County with nearby schools including John L. Golden Elementary, Day Creek Intermediate, and Los Osos High.
Ownership History
Date
Name
Owned For
Owner Type
Purchase Details
Closed on
Jun 13, 2014
Sold by
Clifton Robert L
Bought by
Clifton Robert L Clifton and Clifton Maria Teresa
Current Estimated Value
Purchase Details
Closed on
Oct 15, 2012
Sold by
Clifton Robert L
Bought by
Clifton Maria T
Purchase Details
Closed on
Nov 8, 2002
Sold by
Phillips Harold W
Bought by
Clifton Robert L and Clifton Maria T
Home Financials for this Owner
Home Financials are based on the most recent Mortgage that was taken out on this home.
Original Mortgage
$415,200
Outstanding Balance
$159,152
Interest Rate
4.87%
Mortgage Type
Purchase Money Mortgage
Estimated Equity
$1,090,482
Purchase Details
Closed on
Jun 27, 2001
Sold by
Mastercraft Cucamonga Ii Llc
Bought by
Phillips Harold W and Phillips Lisa D
Home Financials for this Owner
Home Financials are based on the most recent Mortgage that was taken out on this home.
Original Mortgage
$385,240
Interest Rate
9.4%
Create a Home Valuation Report for This Property
The Home Valuation Report is an in-depth analysis detailing your home's value as well as a comparison with similar homes in the area
Home Values in the Area
Average Home Value in this Area
Purchase History
| Date | Buyer | Sale Price | Title Company |
|---|---|---|---|
| Clifton Robert L Clifton | -- | None Available | |
| Clifton Robert L | -- | None Available | |
| Clifton Maria T | -- | Accommodation | |
| Clifton Maria T | -- | Accommodation | |
| Clifton Robert L | $519,000 | Commonwealth Title | |
| Phillips Harold W | $428,500 | First American Title Ins Co |
Source: Public Records
Mortgage History
| Date | Status | Borrower | Loan Amount |
|---|---|---|---|
| Open | Clifton Robert L | $415,200 | |
| Previous Owner | Phillips Harold W | $385,240 |
Source: Public Records
Tax History Compared to Growth
Tax History
| Year | Tax Paid | Tax Assessment Tax Assessment Total Assessment is a certain percentage of the fair market value that is determined by local assessors to be the total taxable value of land and additions on the property. | Land | Improvement |
|---|---|---|---|---|
| 2025 | $8,389 | $751,689 | $187,919 | $563,770 |
| 2024 | $8,389 | $736,950 | $184,234 | $552,716 |
| 2023 | $8,197 | $722,500 | $180,622 | $541,878 |
| 2022 | $8,109 | $708,333 | $177,080 | $531,253 |
| 2021 | $7,978 | $694,444 | $173,608 | $520,836 |
| 2020 | $7,897 | $687,323 | $171,828 | $515,495 |
| 2019 | $7,687 | $673,846 | $168,459 | $505,387 |
| 2018 | $7,852 | $660,633 | $165,156 | $495,477 |
| 2017 | $7,515 | $647,680 | $161,918 | $485,762 |
| 2016 | $7,318 | $661,707 | $231,960 | $429,747 |
| 2015 | $7,549 | $651,768 | $228,476 | $423,292 |
| 2014 | $7,083 | $613,190 | $153,296 | $459,894 |
Source: Public Records
Map
Nearby Homes
- 5675 W Overlook Dr
- 12487 Altura Dr
- 12877 Golden Prairie Dr
- 5450 Stagecoach Ct
- 12430 Split Rein Dr
- 12406 Challendon Dr
- 5231 Flora Ct
- 13123 Carriage Trail Ct
- 6197 Greenwood Place
- 5090 Juneau Ct
- 12794 Windstar Dr
- 5212 Crimson Place
- 12184 Clydesdale Dr
- 12421 Alamo Dr
- 5142 Crimson Place
- 6264 Shore Pine Ct
- 13408 Silver Sky Rd
- 12420 Silk Oak Ct
- 6525 Etiwanda Ave
- 13428 Silver Sky Rd
- 12715 N Overlook Dr
- 5653 W Overlook Dr
- 5650 Camarrio Ct
- 5654 Camarrio Ct
- 12727 N Overlook Dr
- 5657 W Overlook Dr
- 12690 Socorro Dr
- 5644 Camarrio Ct
- 12707 Altura Dr
- 12739 N Overlook Dr
- 5661 W Overlook Dr
- 12641 Socorro Dr
- 12684 Socorro Dr
- 5640 Camarrio Ct
- 12697 Altura Dr
- 5664 Camarrio Ct
- 12747 N Overlook Dr
- 12631 Socorro Dr
- 5667 W Overlook Dr
- 5649 Camarrio Ct