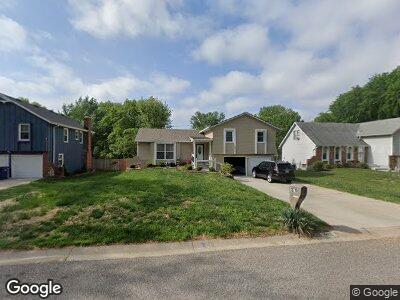
12715 W 100th St Lenexa, KS 66215
Oak Park NeighborhoodEstimated Value: $332,000 - $387,000
3
Beds
3
Baths
1,373
Sq Ft
$257/Sq Ft
Est. Value
About This Home
This home is located at 12715 W 100th St, Lenexa, KS 66215 and is currently estimated at $352,975, approximately $257 per square foot. 12715 W 100th St is a home located in Johnson County with nearby schools including Rosehill Elementary School, Shawnee Mission South High School, and Indian Woods Middle School.
Ownership History
Date
Name
Owned For
Owner Type
Purchase Details
Closed on
Dec 19, 2006
Sold by
Dejene Tesfaye and Dalaye Asreasash
Bought by
Dejene Tesfaye and Belaye Asresash
Current Estimated Value
Home Financials for this Owner
Home Financials are based on the most recent Mortgage that was taken out on this home.
Original Mortgage
$132,000
Interest Rate
6.1%
Mortgage Type
New Conventional
Purchase Details
Closed on
Nov 6, 2002
Sold by
Dejene Tesfaye and Delaye Asresash
Bought by
Dejene Tesfaye and Delaye Asresash
Home Financials for this Owner
Home Financials are based on the most recent Mortgage that was taken out on this home.
Original Mortgage
$120,000
Interest Rate
5.42%
Purchase Details
Closed on
Jan 15, 2002
Sold by
Dejene Tesfaye and Belaye Asresash
Bought by
Dejene Tesfaye and Belaye Asresash
Home Financials for this Owner
Home Financials are based on the most recent Mortgage that was taken out on this home.
Original Mortgage
$120,000
Interest Rate
6.8%
Create a Home Valuation Report for This Property
The Home Valuation Report is an in-depth analysis detailing your home's value as well as a comparison with similar homes in the area
Home Values in the Area
Average Home Value in this Area
Purchase History
| Date | Buyer | Sale Price | Title Company |
|---|---|---|---|
| Dejene Tesfaye | -- | None Available | |
| Dejene Tesfaye | -- | -- | |
| Dejene Tesfaye | -- | Security Land Title Company |
Source: Public Records
Mortgage History
| Date | Status | Borrower | Loan Amount |
|---|---|---|---|
| Closed | Dejene Tesfaye | $169,500 | |
| Closed | Dejene Tesfaye | $168,800 | |
| Closed | Dejene Tesfaye | $122,422 | |
| Closed | Dejene Tesfaye | $25,000 | |
| Closed | Dejene Tesfaye | $132,000 | |
| Closed | Dejene Tesfaye | $120,000 | |
| Closed | Dejene Tesfaye | $120,000 |
Source: Public Records
Tax History Compared to Growth
Tax History
| Year | Tax Paid | Tax Assessment Tax Assessment Total Assessment is a certain percentage of the fair market value that is determined by local assessors to be the total taxable value of land and additions on the property. | Land | Improvement |
|---|---|---|---|---|
| 2024 | $4,067 | $36,869 | $7,742 | $29,127 |
| 2023 | $4,010 | $35,605 | $7,372 | $28,233 |
| 2022 | $3,371 | $29,888 | $6,703 | $23,185 |
| 2021 | $3,338 | $28,002 | $6,089 | $21,913 |
| 2020 | $3,116 | $25,852 | $5,538 | $20,314 |
| 2019 | $2,903 | $24,046 | $4,617 | $19,429 |
| 2018 | $2,903 | $23,839 | $4,617 | $19,222 |
| 2017 | $2,746 | $21,838 | $4,194 | $17,644 |
| 2016 | $2,544 | $19,952 | $3,844 | $16,108 |
| 2015 | $2,405 | $18,975 | $3,844 | $15,131 |
| 2013 | -- | $18,147 | $3,844 | $14,303 |
Source: Public Records
Map
Nearby Homes
- 10208 Noland Rd
- 10229 Gillette St
- 10222 Hauser St
- 10019 Caenen Dr
- 10001 Monrovia St
- 13015 Pennycross Rd
- 12063 W 99th Terrace
- 10421 Hauser St
- 13030 W 105th St
- 10136 Earnshaw St
- 10554 Bradshaw St
- 11720 W 102nd Terrace
- 13223 W 94th St
- 12913 W 92nd Place
- 12311 W 107th Terrace
- 9807 Nieman Place
- 10997 Rosehill Rd
- 9738 Nieman Place
- 10992 Rosehill Rd
- 10921 W 98th St
- 12715 W 100th St
- 12709 W 100th St
- 12721 W 100th St
- 10000 Gillette St
- 12727 W 100th St
- 10003 Gillette St
- 12701 W 100th St
- 10008 Rosehill Rd
- 12718 W 100th St
- 12712 W 100th St
- 12724 W 100th St
- 10006 Gillette St
- 12700 W 100th St
- 12801 W 100th St
- 10014 Rosehill Rd
- 12730 W 100th St
- 10009 Gillette St
- 10012 Gillette St
- 9948 Rosehill Rd
- 10020 Rosehill Rd