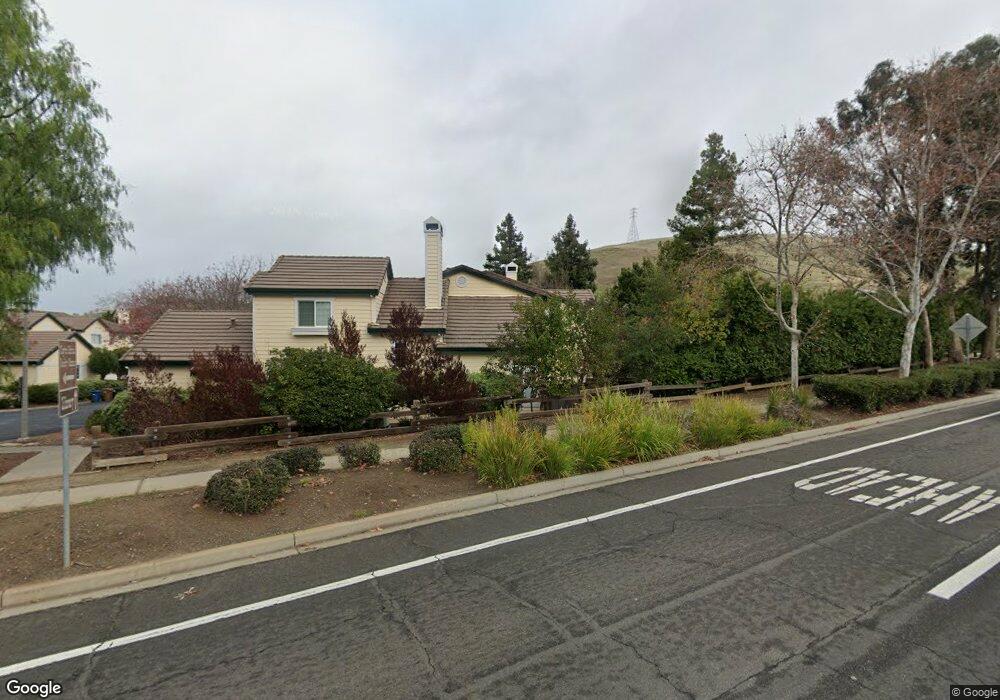
1273 Shell Cir Clayton, CA 94517
Estimated Value: $641,674 - $668,000
2
Beds
3
Baths
1,367
Sq Ft
$478/Sq Ft
Est. Value
About This Home
This home is located at 1273 Shell Cir, Clayton, CA 94517 and is currently estimated at $653,669, approximately $478 per square foot. 1273 Shell Cir is a home located in Contra Costa County with nearby schools including Mt. Diablo Elementary School, Diablo View Middle School, and College Park High School.
Ownership History
Date
Name
Owned For
Owner Type
Purchase Details
Closed on
Apr 9, 2009
Sold by
Oae Margaret and Oae Margaret Naomi
Bought by
Oae Margaret
Current Estimated Value
Home Financials for this Owner
Home Financials are based on the most recent Mortgage that was taken out on this home.
Original Mortgage
$170,000
Interest Rate
5.02%
Mortgage Type
Stand Alone Refi Refinance Of Original Loan
Purchase Details
Closed on
Jun 26, 2003
Sold by
Oae Inaki Margaret N and Inaki Fumihiko
Bought by
Oae Margaret Naomi
Purchase Details
Closed on
Sep 16, 2002
Sold by
Inaki Fumihiko and Oae Inaki Margaret M
Bought by
Inaki Fumihiko and Oae Inaki Margaret N
Home Financials for this Owner
Home Financials are based on the most recent Mortgage that was taken out on this home.
Original Mortgage
$148,000
Interest Rate
6.16%
Mortgage Type
Purchase Money Mortgage
Create a Home Valuation Report for This Property
The Home Valuation Report is an in-depth analysis detailing your home's value as well as a comparison with similar homes in the area
Home Values in the Area
Average Home Value in this Area
Purchase History
| Date | Buyer | Sale Price | Title Company |
|---|---|---|---|
| Oae Margaret | -- | First American Title Company | |
| Oae Margaret Naomi | -- | -- | |
| Inaki Fumihiko | -- | First American Title |
Source: Public Records
Mortgage History
| Date | Status | Borrower | Loan Amount |
|---|---|---|---|
| Closed | Oae Margaret | $170,000 | |
| Closed | Inaki Fumihiko | $148,000 |
Source: Public Records
Tax History
| Year | Tax Paid | Tax Assessment Tax Assessment Total Assessment is a certain percentage of the fair market value that is determined by local assessors to be the total taxable value of land and additions on the property. | Land | Improvement |
|---|---|---|---|---|
| 2025 | $6,068 | $433,439 | $253,067 | $180,372 |
| 2024 | $5,687 | $424,941 | $248,105 | $176,836 |
| 2023 | $5,687 | $416,610 | $243,241 | $173,369 |
| 2022 | $5,711 | $408,442 | $238,472 | $169,970 |
| 2021 | $5,598 | $400,435 | $233,797 | $166,638 |
| 2019 | $5,573 | $388,560 | $226,863 | $161,697 |
| 2018 | $5,367 | $380,942 | $222,415 | $158,527 |
| 2017 | $5,189 | $373,473 | $218,054 | $155,419 |
| 2016 | $5,041 | $366,151 | $213,779 | $152,372 |
| 2015 | $4,971 | $360,652 | $210,568 | $150,084 |
| 2014 | $4,876 | $353,589 | $206,444 | $147,145 |
Source: Public Records
Map
Nearby Homes
- 1383 Shell Ln
- 249 Stranahan Cir
- 1105 Peacock Creek Dr
- 1048 Panadero Ct
- 376 Blue Oak Ln
- 218 Mountaire Cir
- 5849 Mitchell Canyon Ct
- 4 Mt Wilson Way
- 5817 Mitchell Canyon Ct
- 5 Pardi Ln
- 1921 Eagle Peak Ave Unit 28
- 5617 Bettencourt Dr
- 1421 Lydia Ln
- 105 Crow Place
- 5612 Frank Place
- 367 Mt Washington Way
- 186 Mt Wilson Way
- 9005 Elk Dr
- 1897 Camino Estrada
- 1394 El Camino Dr
- 1271 Shell Cir
- 1275 Shell Cir
- 1269 Shell Cir
- 1267 Shell Cir Unit 1
- 1167 Shell Ln
- 1332 Shell Ln
- 1277 Shell Cir
- 1265 Shell Cir Unit 1
- 1281 Shell Cir
- 1169 Shell Ln
- 1330 Shell Ln
- 1283 Shell Cir
- 1279 Shell Cir Unit 1
- 1181 Shell Ln
- 1263 Shell Cir
- 1328 Shell Ln
- 1270 Shell Cir
- 1171 Shell Ln
- 1272 Shell Cir
- 1276 Shell Cir
Your Personal Tour Guide
Ask me questions while you tour the home.