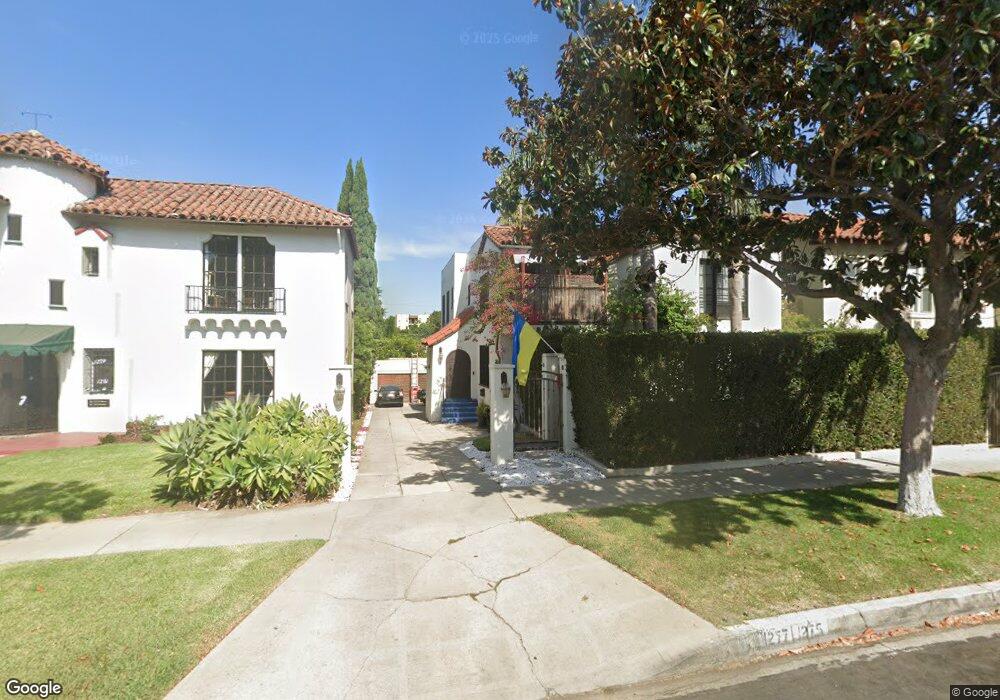
1275 S Citrus Ave Los Angeles, CA 90019
Miracle Mile NeighborhoodEstimated Value: $1,528,000 - $1,769,000
4
Beds
3
Baths
2,892
Sq Ft
$563/Sq Ft
Est. Value
About This Home
This home is located at 1275 S Citrus Ave, Los Angeles, CA 90019 and is currently estimated at $1,628,326, approximately $563 per square foot. 1275 S Citrus Ave is a home located in Los Angeles County with nearby schools including Wilshire Crest Elementary School, John Burroughs Middle School, and Los Angeles Senior High School.
Ownership History
Date
Name
Owned For
Owner Type
Purchase Details
Closed on
Jun 5, 2006
Sold by
Zdrojewska Julia
Bought by
Bakowski Maciek
Current Estimated Value
Purchase Details
Closed on
Jan 9, 2003
Sold by
Wiggins Cheryl
Bought by
Bakowski Maciek
Home Financials for this Owner
Home Financials are based on the most recent Mortgage that was taken out on this home.
Original Mortgage
$480,000
Outstanding Balance
$203,878
Interest Rate
5.96%
Estimated Equity
$1,424,448
Purchase Details
Closed on
Aug 14, 2000
Sold by
Smith Quincy
Bought by
Wiggins Cheryl
Home Financials for this Owner
Home Financials are based on the most recent Mortgage that was taken out on this home.
Original Mortgage
$262,500
Interest Rate
8.3%
Purchase Details
Closed on
Dec 22, 1998
Sold by
Bergman Brett
Bought by
Smith Quincy
Home Financials for this Owner
Home Financials are based on the most recent Mortgage that was taken out on this home.
Original Mortgage
$206,100
Interest Rate
6.78%
Create a Home Valuation Report for This Property
The Home Valuation Report is an in-depth analysis detailing your home's value as well as a comparison with similar homes in the area
Home Values in the Area
Average Home Value in this Area
Purchase History
| Date | Buyer | Sale Price | Title Company |
|---|---|---|---|
| Bakowski Maciek | -- | None Available | |
| Bakowski Maciek | $600,000 | Landsafe Title | |
| Wiggins Cheryl | $350,000 | Investors Title Company | |
| Smith Quincy | $229,000 | Equity Title Company |
Source: Public Records
Mortgage History
| Date | Status | Borrower | Loan Amount |
|---|---|---|---|
| Open | Bakowski Maciek | $480,000 | |
| Previous Owner | Wiggins Cheryl | $262,500 | |
| Previous Owner | Smith Quincy | $206,100 | |
| Closed | Bakowski Maciek | $40,000 |
Source: Public Records
Tax History Compared to Growth
Tax History
| Year | Tax Paid | Tax Assessment Tax Assessment Total Assessment is a certain percentage of the fair market value that is determined by local assessors to be the total taxable value of land and additions on the property. | Land | Improvement |
|---|---|---|---|---|
| 2025 | $10,672 | $868,979 | $557,597 | $311,382 |
| 2024 | $10,672 | $851,941 | $546,664 | $305,277 |
| 2023 | $10,472 | $835,238 | $535,946 | $299,292 |
| 2022 | $9,996 | $818,862 | $525,438 | $293,424 |
| 2021 | $9,862 | $802,807 | $515,136 | $287,671 |
| 2019 | $9,572 | $778,997 | $499,857 | $279,140 |
| 2018 | $9,449 | $763,723 | $490,056 | $273,667 |
| 2016 | $9,020 | $734,069 | $471,028 | $263,041 |
| 2015 | $8,890 | $723,043 | $463,953 | $259,090 |
| 2014 | $8,928 | $708,880 | $454,865 | $254,015 |
Source: Public Records
Map
Nearby Homes
- 1296 S Citrus Ave
- 1200 S Citrus Ave
- 1247 S Sycamore Ave
- 1122 S Sycamore Ave
- 1273 S Sycamore Ave
- 1289 S Sycamore Ave
- 1373 S Orange Dr
- 1226 Meadowbrook Ave
- 1073 S Mansfield Ave
- 1638 S Longwood Ave
- 1245 S Hudson Ave
- 4817 Saint Charles Place
- 1036 S Citrus Ave
- 5212 Packard St
- 1100 S Highland Ave
- 1327 Meadowbrook Ave
- 1307 S Rimpau Blvd
- 1210 S Cochran Ave
- 1208 S Cochran Ave
- 1656 S Rimpau Blvd
- 1269 S Citrus Ave Unit 1
- 1269 S Citrus Ave Unit 8
- 1269 S Citrus Ave
- 1269 S Citrus Ave Unit 6
- 1269 S Citrus Ave Unit 2
- 1269 S Citrus Ave Unit 3
- 1281 S Citrus Ave
- 1279 S Citrus Ave Unit 4
- 1279 S Citrus Ave
- 1283 S Citrus Ave
- 1276 S Citrus Ave
- 1280 S Citrus Ave
- 1280 S Citrus Ave Unit 1/2
- 1274 S Citrus Ave Unit 1276
- 1274 S Citrus Ave
- 1268 S Citrus Ave
- 1278 S Citrus Ave Unit 1/2
- 1278 S Citrus Ave
- 1286 S Citrus Ave Unit 1/2
- 1266 S Citrus Ave