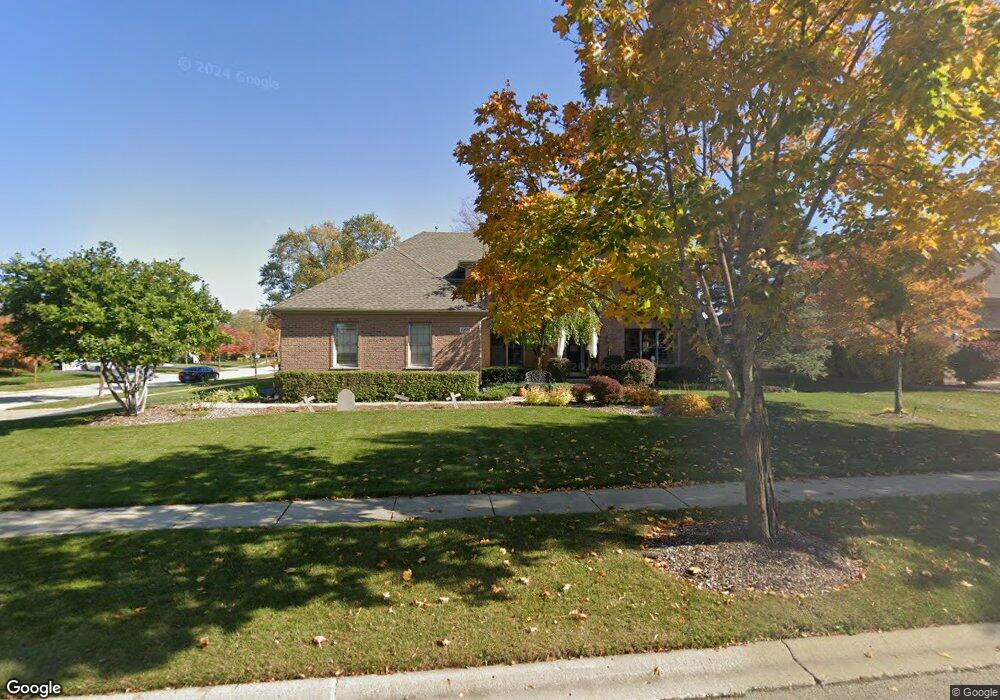
1275 Tunbridge Trail Algonquin, IL 60102
Estimated Value: $516,000 - $634,000
4
Beds
3
Baths
3,465
Sq Ft
$168/Sq Ft
Est. Value
About This Home
This home is located at 1275 Tunbridge Trail, Algonquin, IL 60102 and is currently estimated at $581,187, approximately $167 per square foot. 1275 Tunbridge Trail is a home located in McHenry County with nearby schools including Westfield Community School, Kenneth E Neubert Elementary School, and Harry D Jacobs High School.
Ownership History
Date
Name
Owned For
Owner Type
Purchase Details
Closed on
Oct 20, 2017
Sold by
Flower Thomas W and Flower Catherina N
Bought by
Flower Thomas W and Flower Caterina N
Current Estimated Value
Purchase Details
Closed on
Sep 10, 1997
Sold by
Legacy Fine Custom Homes Inc
Bought by
Flower Thomas W and Flower Caterina N
Home Financials for this Owner
Home Financials are based on the most recent Mortgage that was taken out on this home.
Original Mortgage
$243,000
Outstanding Balance
$36,931
Interest Rate
7.25%
Estimated Equity
$544,256
Purchase Details
Closed on
Sep 3, 1997
Sold by
Sentry Construction Inc
Bought by
Legacy Fine Custom Homes Inc
Home Financials for this Owner
Home Financials are based on the most recent Mortgage that was taken out on this home.
Original Mortgage
$243,000
Outstanding Balance
$36,931
Interest Rate
7.25%
Estimated Equity
$544,256
Create a Home Valuation Report for This Property
The Home Valuation Report is an in-depth analysis detailing your home's value as well as a comparison with similar homes in the area
Purchase History
| Date | Buyer | Sale Price | Title Company |
|---|---|---|---|
| Flower Thomas W | -- | Attorney | |
| Flower Thomas W | $308,500 | First American Title | |
| Legacy Fine Custom Homes Inc | $65,000 | First American Title |
Source: Public Records
Mortgage History
| Date | Status | Borrower | Loan Amount |
|---|---|---|---|
| Open | Flower Thomas W | $243,000 |
Source: Public Records
Tax History Compared to Growth
Tax History
| Year | Tax Paid | Tax Assessment Tax Assessment Total Assessment is a certain percentage of the fair market value that is determined by local assessors to be the total taxable value of land and additions on the property. | Land | Improvement |
|---|---|---|---|---|
| 2024 | $14,626 | $194,974 | $34,253 | $160,721 |
| 2023 | $13,928 | $174,380 | $30,635 | $143,745 |
| 2022 | $12,577 | $152,654 | $39,522 | $113,132 |
| 2021 | $12,087 | $142,215 | $36,819 | $105,396 |
| 2020 | $11,779 | $137,181 | $35,516 | $101,665 |
| 2019 | $11,505 | $131,299 | $33,993 | $97,306 |
| 2018 | $10,989 | $121,292 | $31,402 | $89,890 |
| 2017 | $10,781 | $114,265 | $29,583 | $84,682 |
| 2016 | $10,639 | $107,170 | $27,746 | $79,424 |
| 2013 | -- | $86,439 | $25,883 | $60,556 |
Source: Public Records
Map
Nearby Homes
- 000 County Line Rd
- 2380 Dawson Ln Unit 165
- 18 Peach Tree Ct Unit 4154
- 2233 Dawson Ln Unit 312
- 741 Regal Ln
- 681 Majestic Dr
- 1820 Crofton Dr
- 1801 Arbordale Ln
- 1033 Interloch Ct Unit 32
- 30 Arbordale Ct Unit 4284
- 1900 Waverly Ln
- 1920 Jester Ln
- 700 Fairfield Ln
- 1405 Surrey Ln
- 2601 Harnish Dr
- 895 Eineke Blvd
- DOVER Plan at Grand Reserve - Algonquin
- CLIFTON Plan at Grand Reserve - Algonquin
- 1 N Hubbard St
- SWC Talaga and Algonquin Rd
- 1285 Tunbridge Trail
- 2071 Brindlewood Ln Unit 2
- 2080 Brindlewood Ln
- 1295 Tunbridge Trail
- 2061 Brindlewood Ln
- 2070 Brindlewood Ln Unit 2
- 1270 Tunbridge Trail
- 1260 Tunbridge Trail Unit 2
- 1280 Tunbridge Trail
- 2060 Brindlewood Ln
- 1250 Tunbridge Trail
- 1255 Tunbridge Trail
- 1290 Tunbridge Trail
- 2051 Brindlewood Ln
- 1305 Tunbridge Trail
- 2050 Brindlewood Ln
- 1240 Tunbridge Trail
- 2041 Brindlewood Ln
- 2073 Tunbridge Trail
- 2063 Tunbridge Trail