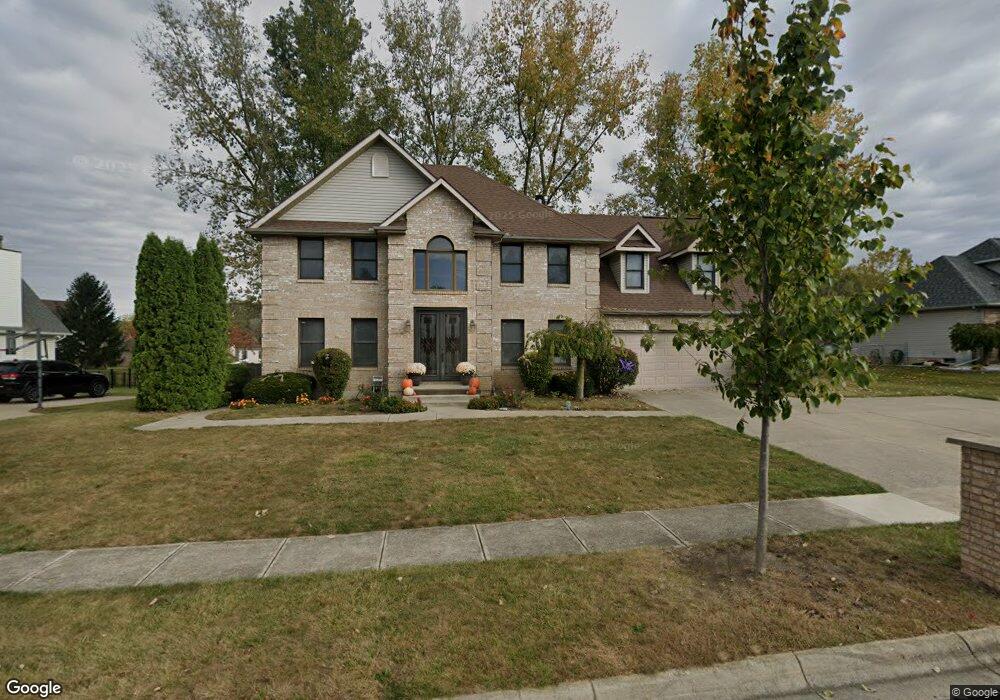
1276 Quinlan Ct Springfield, OH 45503
Estimated Value: $434,848 - $484,000
5
Beds
4
Baths
3,749
Sq Ft
$123/Sq Ft
Est. Value
About This Home
This home is located at 1276 Quinlan Ct, Springfield, OH 45503 and is currently estimated at $461,616, approximately $123 per square foot. 1276 Quinlan Ct is a home located in Clark County with nearby schools including Northridge Elementary School, Kenton Ridge Middle & High School, and Emmanuel Christian Academy.
Ownership History
Date
Name
Owned For
Owner Type
Purchase Details
Closed on
Oct 30, 2015
Sold by
Stuttman Richard L and Stuttman Joanne K
Bought by
Dennis Damien S and Dennis Lindsey N
Current Estimated Value
Home Financials for this Owner
Home Financials are based on the most recent Mortgage that was taken out on this home.
Original Mortgage
$275,793
Outstanding Balance
$216,021
Interest Rate
3.91%
Mortgage Type
FHA
Estimated Equity
$245,595
Purchase Details
Closed on
Jan 25, 2001
Sold by
Nelson Sheila R
Bought by
Stuttman Richard L and Stuttman Joanne K
Purchase Details
Closed on
Mar 12, 1997
Sold by
Fritts Joseph K
Bought by
Nelson Sheila R
Home Financials for this Owner
Home Financials are based on the most recent Mortgage that was taken out on this home.
Original Mortgage
$52,500
Interest Rate
6%
Mortgage Type
New Conventional
Create a Home Valuation Report for This Property
The Home Valuation Report is an in-depth analysis detailing your home's value as well as a comparison with similar homes in the area
Home Values in the Area
Average Home Value in this Area
Purchase History
| Date | Buyer | Sale Price | Title Company |
|---|---|---|---|
| Dennis Damien S | $282,000 | Attorney | |
| Stuttman Richard L | $262,000 | -- | |
| Nelson Sheila R | $210,000 | -- |
Source: Public Records
Mortgage History
| Date | Status | Borrower | Loan Amount |
|---|---|---|---|
| Open | Dennis Damien S | $275,793 | |
| Previous Owner | Nelson Sheila R | $52,500 |
Source: Public Records
Tax History
| Year | Tax Paid | Tax Assessment Tax Assessment Total Assessment is a certain percentage of the fair market value that is determined by local assessors to be the total taxable value of land and additions on the property. | Land | Improvement |
|---|---|---|---|---|
| 2025 | $5,249 | $141,030 | $26,750 | $114,280 |
| 2024 | $5,072 | $123,770 | $22,400 | $101,370 |
| 2023 | $5,072 | $123,770 | $22,400 | $101,370 |
| 2022 | $5,091 | $123,770 | $22,400 | $101,370 |
| 2021 | $4,646 | $96,910 | $17,370 | $79,540 |
| 2020 | $4,651 | $96,910 | $17,370 | $79,540 |
| 2019 | $4,744 | $96,910 | $17,370 | $79,540 |
| 2018 | $4,480 | $88,480 | $17,770 | $70,710 |
| 2017 | $3,807 | $97,696 | $17,770 | $79,926 |
| 2016 | $3,779 | $97,696 | $17,770 | $79,926 |
| 2015 | $4,154 | $96,278 | $18,704 | $77,574 |
| 2014 | $4,154 | $96,278 | $18,704 | $77,574 |
| 2013 | $4,145 | $96,278 | $18,704 | $77,574 |
Source: Public Records
Map
Nearby Homes
- 1201 Kingsgate Rd
- 1162 Kingsgate Rd
- 1500 Kingsgate Rd Unit 19430
- 1502 Kingsgate Rd Unit 19432
- 1500 Kingsgate Rd
- 1502 Kingsgate Rd
- 3631 Kingsgate Ln
- 1503 Kingsgate Rd
- 1505 Kingsgate Rd
- 1507 Kingsgate Rd
- 3052 Brixton Dr E
- 1136 Foxboro Rd Unit 202
- 1139 Bradford Dr
- 1415 Montego Dr
- 1811 Saint Andrews Ct
- 1039 Bradford Dr Unit 42
- 1644 Delmar Dr
- 4256 Midfield St Unit 9
- 4322 Midfield St Unit 15
- 1341 Student Ave
- 1286 Quinlan Ct
- 1256 Quinlan Ct
- 1296 Quinlan Ct
- 1305 Kingsgate Rd
- 1275 Quinlan Ct
- 1311 Kingsgate Rd
- 3136 Campbell Dr
- 1285 Quinlan Ct
- 1265 Quinlan Ct
- 3140 Campbell Dr
- 3130 Campbell Dr
- 1306 Quinlan Ct
- 1295 Quinlan Ct
- 1301 Kingsgate Rd
- 1255 Quinlan Ct
- 3118 Campbell Dr
- 1343 Kingsgate Rd
- 1305 Quinlan Ct
- 1276 Ryan Rd
- 1316 Quinlan Ct
Your Personal Tour Guide
Ask me questions while you tour the home.