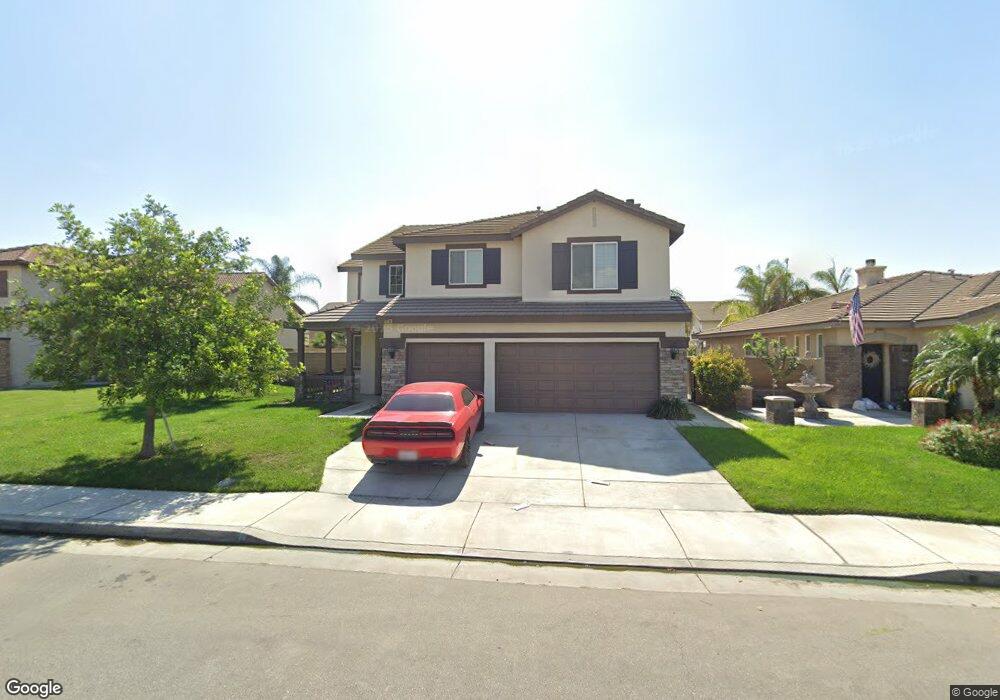
12761 Castle Rd Corona, CA 92880
Estimated Value: $855,000 - $986,000
4
Beds
3
Baths
3,031
Sq Ft
$305/Sq Ft
Est. Value
About This Home
This home is located at 12761 Castle Rd, Corona, CA 92880 and is currently estimated at $925,430, approximately $305 per square foot. 12761 Castle Rd is a home located in Riverside County with nearby schools including Eastvale Elementary School, River Heights Intermediate School, and Eleanor Roosevelt High School.
Ownership History
Date
Name
Owned For
Owner Type
Purchase Details
Closed on
Sep 27, 2021
Sold by
Chen Wen Won
Bought by
Tseng Steve and Chen Wen Won
Current Estimated Value
Home Financials for this Owner
Home Financials are based on the most recent Mortgage that was taken out on this home.
Original Mortgage
$425,000
Outstanding Balance
$388,009
Interest Rate
2.88%
Estimated Equity
$537,421
Purchase Details
Closed on
Jun 25, 2011
Sold by
Bass Mai
Bought by
Chen Wen Wen
Purchase Details
Closed on
Jun 22, 2011
Sold by
Tseng Steve
Bought by
Chen Wen Wen
Purchase Details
Closed on
Feb 20, 2007
Sold by
North Valley 95 Llc
Bought by
Bass Mai
Home Financials for this Owner
Home Financials are based on the most recent Mortgage that was taken out on this home.
Original Mortgage
$438,950
Interest Rate
6.62%
Mortgage Type
Purchase Money Mortgage
Create a Home Valuation Report for This Property
The Home Valuation Report is an in-depth analysis detailing your home's value as well as a comparison with similar homes in the area
Home Values in the Area
Average Home Value in this Area
Purchase History
| Date | Buyer | Sale Price | Title Company |
|---|---|---|---|
| Tseng Steve | -- | California Best Title | |
| Chen Wen Wen | $310,000 | North American Title Co Inc | |
| Chen Wen Wen | -- | North American Title Co Inc | |
| Bass Mai | $549,000 | Fidelity National Title Buil |
Source: Public Records
Mortgage History
| Date | Status | Borrower | Loan Amount |
|---|---|---|---|
| Open | Tseng Steve | $425,000 | |
| Previous Owner | Bass Mai | $438,950 |
Source: Public Records
Tax History
| Year | Tax Paid | Tax Assessment Tax Assessment Total Assessment is a certain percentage of the fair market value that is determined by local assessors to be the total taxable value of land and additions on the property. | Land | Improvement |
|---|---|---|---|---|
| 2025 | $6,910 | $389,362 | $138,156 | $251,206 |
| 2023 | $6,910 | $374,245 | $132,793 | $241,452 |
| 2022 | $6,970 | $366,908 | $130,190 | $236,718 |
| 2021 | $6,856 | $359,715 | $127,639 | $232,076 |
| 2020 | $6,750 | $356,028 | $126,331 | $229,697 |
| 2019 | $6,625 | $349,048 | $123,854 | $225,194 |
| 2018 | $6,533 | $342,205 | $121,426 | $220,779 |
| 2017 | $6,403 | $335,496 | $119,046 | $216,450 |
| 2016 | $6,287 | $328,918 | $116,712 | $212,206 |
| 2015 | $6,182 | $323,979 | $114,960 | $209,019 |
| 2014 | $6,082 | $317,635 | $112,709 | $204,926 |
Source: Public Records
Map
Nearby Homes
- 6805 Edinburgh Rd
- 12760 Excalibur Dr
- 12722 Kristi Lynn Ct
- 12938 Meridian Ct
- 7154 Ohio River Dr
- 6854 Farmall Way
- 12554 Desert Springs St
- 6732 Rico Ct
- 7076 Luminaire Ct
- 6765 Borges St
- 12966 Eastern Shore Dr
- 12657 Burbank Rd
- 6974 Riverboat Dr
- 6792 Wells Springs St
- 12714 Burbank Rd
- 7342 Excelsior Dr
- 6835 Noric Cir
- 12812 Clemson Dr
- 6713 Leanne St
- 7395 Patti Ann Ct
- 12731 Castle Rd
- 12791 Castle Rd
- 12808 Thornbury Ln
- 12782 Thornbury Ln
- 12821 Castle Rd
- 12834 Thornbury Ln
- 12701 Castle Rd
- 12756 Thornbury Ln
- 12760 Castle Rd
- 12790 Castle Rd
- 12730 Castle Rd
- 12860 Thornbury Ln
- 12851 Castle Rd
- 12730 Thornbury Ln
- 12820 Castle Rd
- 6948 Armour Cir
- 12886 Thornbury Ln
- 6934 Armour Cir
- 6911 Armour Cir
- 12850 Castle Rd
Your Personal Tour Guide
Ask me questions while you tour the home.