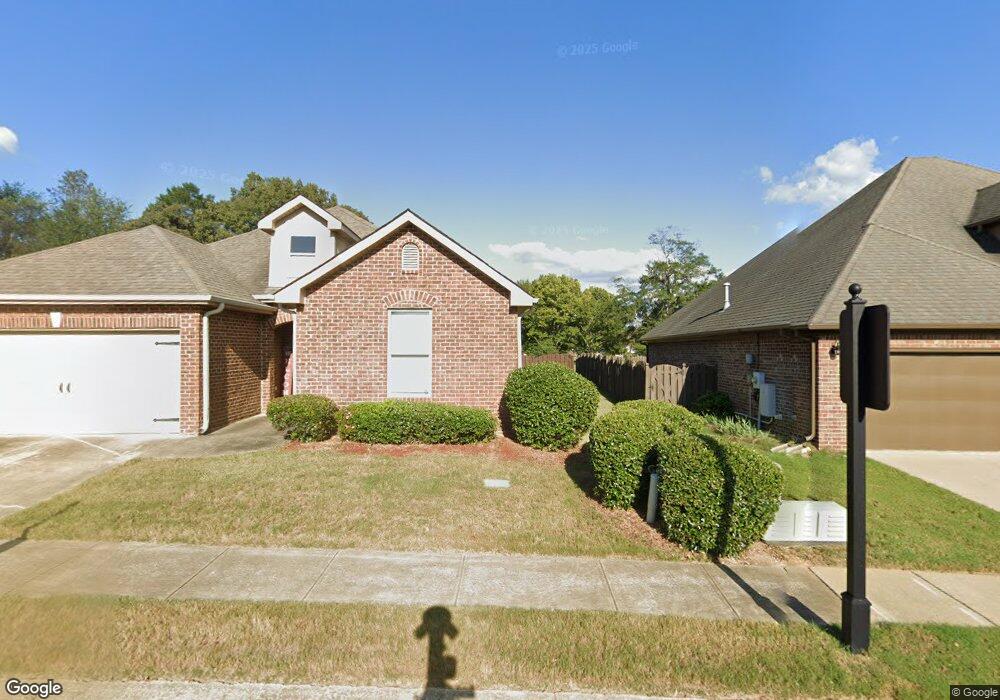
12761 Olmsted Cir Unit 2002 Mc Calla, AL 35111
Estimated Value: $287,000 - $313,000
4
Beds
2
Baths
1,847
Sq Ft
$162/Sq Ft
Est. Value
About This Home
This home is located at 12761 Olmsted Cir Unit 2002, Mc Calla, AL 35111 and is currently estimated at $300,005, approximately $162 per square foot. 12761 Olmsted Cir Unit 2002 is a home located in Tuscaloosa County with nearby schools including Lake View Elementary School, Brookwood Middle School, and Brookwood High School.
Ownership History
Date
Name
Owned For
Owner Type
Purchase Details
Closed on
Feb 28, 2024
Sold by
Farmer Tyraus J
Bought by
Farmer Tyraus J
Current Estimated Value
Purchase Details
Closed on
Aug 16, 2023
Sold by
Eco-Preservation Services Llc
Bought by
Farmer Tyraus J
Purchase Details
Closed on
Nov 1, 2021
Sold by
Wilson Joel R
Bought by
Farmer Tyraus J
Home Financials for this Owner
Home Financials are based on the most recent Mortgage that was taken out on this home.
Original Mortgage
$260,098
Interest Rate
3.01%
Mortgage Type
FHA
Purchase Details
Closed on
Aug 24, 2011
Sold by
D R Horton Inc - Birmingha
Bought by
Wilson Joel R and Wilson Daren D
Home Financials for this Owner
Home Financials are based on the most recent Mortgage that was taken out on this home.
Original Mortgage
$129,671
Interest Rate
4.4%
Mortgage Type
Commercial
Create a Home Valuation Report for This Property
The Home Valuation Report is an in-depth analysis detailing your home's value as well as a comparison with similar homes in the area
Home Values in the Area
Average Home Value in this Area
Purchase History
| Date | Buyer | Sale Price | Title Company |
|---|---|---|---|
| Farmer Tyraus J | $500 | None Listed On Document | |
| Farmer Tyraus J | $6,952 | None Listed On Document | |
| Farmer Tyraus J | $264,900 | -- | |
| Wilson Joel R | $187,071 | -- |
Source: Public Records
Mortgage History
| Date | Status | Borrower | Loan Amount |
|---|---|---|---|
| Previous Owner | Farmer Tyraus J | $260,098 | |
| Previous Owner | Wilson Joel R | $129,671 |
Source: Public Records
Tax History Compared to Growth
Tax History
| Year | Tax Paid | Tax Assessment Tax Assessment Total Assessment is a certain percentage of the fair market value that is determined by local assessors to be the total taxable value of land and additions on the property. | Land | Improvement |
|---|---|---|---|---|
| 2024 | $885 | $54,360 | $6,200 | $48,160 |
| 2023 | $1,740 | $51,280 | $6,200 | $45,080 |
| 2022 | $669 | $44,720 | $6,200 | $38,520 |
| 2021 | $669 | $44,720 | $6,200 | $38,520 |
| 2020 | $600 | $20,210 | $3,100 | $17,110 |
| 2019 | $600 | $20,210 | $3,100 | $17,110 |
| 2018 | $600 | $20,210 | $3,100 | $17,110 |
| 2017 | $450 | $0 | $0 | $0 |
| 2016 | $457 | $0 | $0 | $0 |
| 2015 | $389 | $0 | $0 | $0 |
| 2014 | -- | $17,610 | $3,100 | $14,510 |
Source: Public Records
Map
Nearby Homes
- 22806 Rimbred Ct
- 7947 Gristmill Dr
- 12772 Ironstone Dr
- 12766 Ironstone Dr
- 12760 Ironstone Dr
- 12754 Ironstone Dr
- 12748 Ironstone Dr
- 12742 Ironstone Dr
- 12736 Ironstone Dr
- 12880 Collier Curve
- 22873 Downing Park Cir
- 12724 Ironstone Dr
- 12718 Ironstone Dr
- 0 Tannehill Pkwy Unit 54712
- The Cali Plan at Tannehill
- The Aaron Plan at Tannehill
- The Freeport Plan at Tannehill
- The Arden Plan at Tannehill
- The Penwell Plan at Tannehill
- The Aldridge Plan at Tannehill
- 12761 Olmsted Cir
- 12767 Olmsted Cir
- 12767 Olmsted Cir Unit 23
- 12671 Olmsted Cir
- 12755 Olmsted Cir
- 12755 Olmsted Cir Unit 2*01
- 12773 Olmsted Cir
- 12773 Olmsted Cir Unit 24
- 12773 Olmsted Cir Unit 204
- 12764 Olmsted Cir
- 12764 Olmsted Cir
- 12764 Olmsted Cir Unit 2*90
- 12758 Olmsted Cir
- 12758 Olmsted Cir Unit 291
- 12770 Olmsted Cir
- 12779 Olmsted Cir
- 12779 Olmsted Cir Unit 2005
- 12776 Olmsted Cir
- 12776 Olmsted Cir Unit 291
- 12776 Olmsted Cir Unit 288