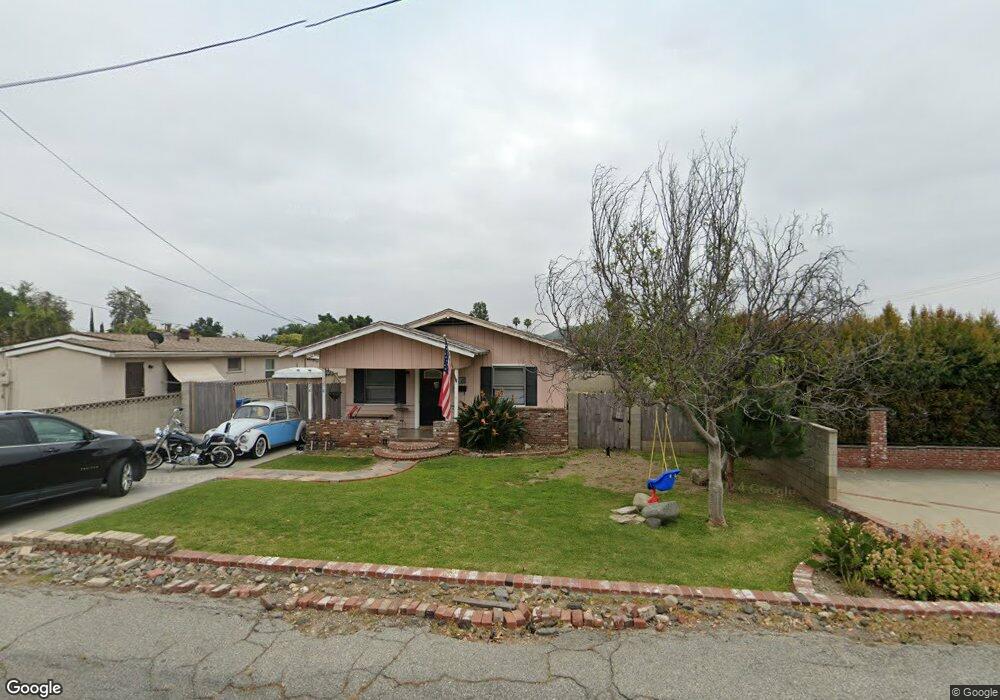
1278 E Foothill Blvd Glendora, CA 91741
South Glendora NeighborhoodEstimated Value: $693,000 - $764,210
3
Beds
1
Bath
870
Sq Ft
$854/Sq Ft
Est. Value
About This Home
This home is located at 1278 E Foothill Blvd, Glendora, CA 91741 and is currently estimated at $742,803, approximately $853 per square foot. 1278 E Foothill Blvd is a home located in Los Angeles County with nearby schools including Sellers Elementary School, Goddard Middle School, and Glendora High School.
Ownership History
Date
Name
Owned For
Owner Type
Purchase Details
Closed on
Oct 23, 2020
Sold by
Herrera Jose R and Herrera Zarina E
Bought by
Herrera Jose R and Herrera Zarina E
Current Estimated Value
Home Financials for this Owner
Home Financials are based on the most recent Mortgage that was taken out on this home.
Original Mortgage
$468,000
Outstanding Balance
$415,502
Interest Rate
2.8%
Mortgage Type
VA
Estimated Equity
$327,301
Purchase Details
Closed on
Apr 27, 2007
Sold by
Herrera Juan
Bought by
Herrera Jose Rosario
Purchase Details
Closed on
Dec 7, 2006
Sold by
Markwith Erna Rae and The Lois A Black Trust
Bought by
Herrera Juan
Home Financials for this Owner
Home Financials are based on the most recent Mortgage that was taken out on this home.
Original Mortgage
$344,000
Interest Rate
6.75%
Mortgage Type
Purchase Money Mortgage
Create a Home Valuation Report for This Property
The Home Valuation Report is an in-depth analysis detailing your home's value as well as a comparison with similar homes in the area
Home Values in the Area
Average Home Value in this Area
Purchase History
| Date | Buyer | Sale Price | Title Company |
|---|---|---|---|
| Herrera Jose R | -- | Western Resources Title | |
| Herrera Jose Rosario | -- | Accommodation | |
| Herrera Juan | $430,000 | Southland Title Corporation |
Source: Public Records
Mortgage History
| Date | Status | Borrower | Loan Amount |
|---|---|---|---|
| Open | Herrera Jose R | $468,000 | |
| Previous Owner | Herrera Juan | $344,000 |
Source: Public Records
Tax History
| Year | Tax Paid | Tax Assessment Tax Assessment Total Assessment is a certain percentage of the fair market value that is determined by local assessors to be the total taxable value of land and additions on the property. | Land | Improvement |
|---|---|---|---|---|
| 2025 | $6,997 | $576,089 | $460,878 | $115,211 |
| 2024 | $6,997 | $564,794 | $451,842 | $112,952 |
| 2023 | $6,837 | $553,721 | $442,983 | $110,738 |
| 2022 | $6,495 | $542,865 | $434,298 | $108,567 |
| 2021 | $4,731 | $532,222 | $425,783 | $106,439 |
| 2019 | $5,576 | $475,000 | $380,000 | $95,000 |
| 2018 | $5,489 | $475,000 | $380,000 | $95,000 |
| 2016 | $4,742 | $408,000 | $326,400 | $81,600 |
| 2015 | $4,026 | $345,600 | $276,500 | $69,100 |
| 2014 | $3,592 | $300,000 | $240,000 | $60,000 |
Source: Public Records
Map
Nearby Homes
- 137 N Burnaby Dr
- 1241 E Mountain View Ave
- 1422 Lawford St
- 1258 Cossacks Place
- 1005 E Woodland Ln
- 1449 E Bennett Ave
- 141 Sandalwood Place
- 920 E Carroll Ave
- 1627 Oak Tree Ln
- 925 E Walnut Ave
- 1060 E Route 66
- 451 Sellers St Unit 29
- 425 Fern Dell Place
- 514 N Valley Center Ave
- 705 Beaverbrook Ln
- 826 E Route 66
- 112 S Hacienda Ave
- 138 S Hacienda Ave
- 733 E Route 66
- 729 E Route 66
- 101 S San Jose Dr
- 1266 E Foothill Blvd
- 115 S San Jose Dr
- 121 S San Jose Dr
- 1310 E Foothill Blvd
- 102 S Treanor Ave
- 103 N San Jose Dr
- 108 S Treanor Ave
- 127 S San Jose Dr
- 114 S Treanor Ave
- 1303 E Foothill Blvd
- 116 S San Jose Dr
- 1241 E Foothill Blvd
- 120 S Treanor Ave
- 133 S San Jose Dr
- 1316 E Foothill Blvd
- 107 N San Jose Dr
- 124 S San Jose Dr
- 1235 E Foothill Blvd
- 126 S Treanor Ave
Your Personal Tour Guide
Ask me questions while you tour the home.