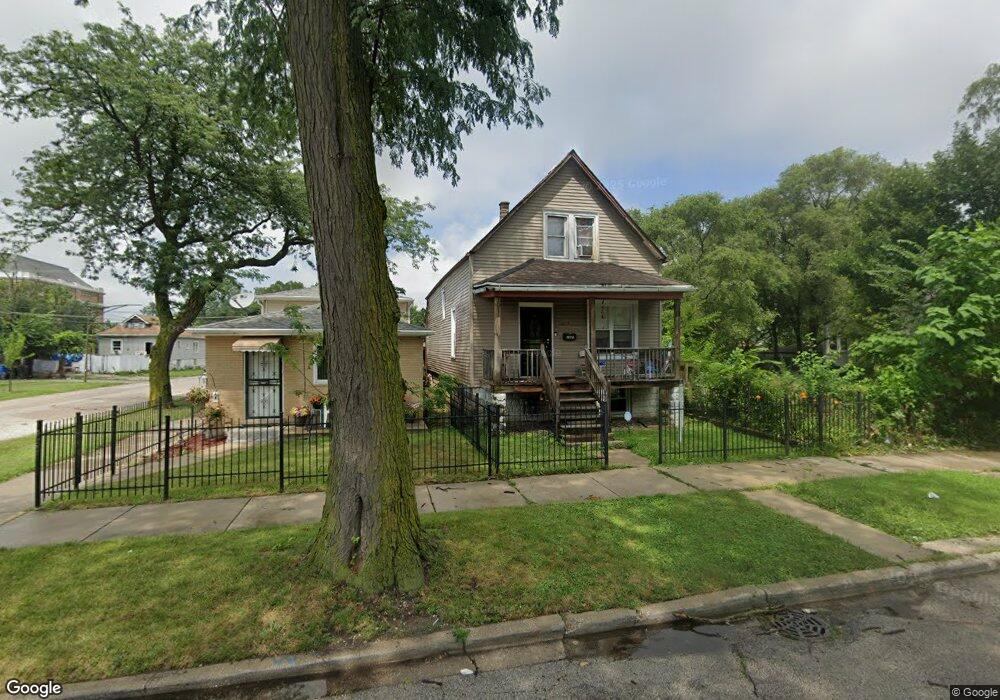
1278 W 71st Place Chicago, IL 60636
Englewood NeighborhoodEstimated Value: $91,000 - $152,000
3
Beds
2
Baths
882
Sq Ft
$134/Sq Ft
Est. Value
About This Home
This home is located at 1278 W 71st Place, Chicago, IL 60636 and is currently estimated at $117,839, approximately $133 per square foot. 1278 W 71st Place is a home located in Cook County with nearby schools including Bond Elementary School and The Montessori School of Englewood Charter School.
Ownership History
Date
Name
Owned For
Owner Type
Purchase Details
Closed on
Aug 26, 2011
Sold by
Secretary Of Housing & Urban Development
Bought by
Coney William
Current Estimated Value
Purchase Details
Closed on
Aug 2, 2010
Sold by
Williams Karen L
Bought by
The Secretary Of Housing & Urban Develop
Purchase Details
Closed on
Mar 10, 2009
Sold by
Holmes John E
Bought by
Williams Karen L
Purchase Details
Closed on
Nov 13, 2006
Sold by
Holmes John E
Bought by
Holmes John E and Williams Karen L
Purchase Details
Closed on
Aug 17, 2006
Sold by
Holmes Aria L
Bought by
Holmes John E
Purchase Details
Closed on
Aug 16, 2001
Sold by
Daniel Martha
Bought by
Williams Karen L and Holmes Aria L
Home Financials for this Owner
Home Financials are based on the most recent Mortgage that was taken out on this home.
Original Mortgage
$68,388
Interest Rate
6.88%
Mortgage Type
FHA
Create a Home Valuation Report for This Property
The Home Valuation Report is an in-depth analysis detailing your home's value as well as a comparison with similar homes in the area
Home Values in the Area
Average Home Value in this Area
Purchase History
| Date | Buyer | Sale Price | Title Company |
|---|---|---|---|
| Coney William | -- | Stewart Title Company | |
| The Secretary Of Housing & Urban Develop | -- | None Available | |
| Williams Karen L | -- | None Available | |
| Holmes John E | -- | None Available | |
| Holmes John E | -- | None Available | |
| Williams Karen L | $69,000 | -- |
Source: Public Records
Mortgage History
| Date | Status | Borrower | Loan Amount |
|---|---|---|---|
| Previous Owner | Williams Karen L | $68,388 |
Source: Public Records
Tax History Compared to Growth
Tax History
| Year | Tax Paid | Tax Assessment Tax Assessment Total Assessment is a certain percentage of the fair market value that is determined by local assessors to be the total taxable value of land and additions on the property. | Land | Improvement |
|---|---|---|---|---|
| 2024 | $633 | $5,601 | $938 | $4,663 |
| 2023 | $617 | $3,000 | $1,502 | $1,498 |
| 2022 | $617 | $3,000 | $1,502 | $1,498 |
| 2021 | $603 | $3,001 | $1,503 | $1,498 |
| 2020 | $1,407 | $6,316 | $2,343 | $3,973 |
| 2019 | $1,410 | $7,018 | $2,343 | $4,675 |
| 2018 | $1,386 | $7,018 | $2,343 | $4,675 |
| 2017 | $1,950 | $9,058 | $2,031 | $7,027 |
| 2016 | $1,814 | $9,058 | $2,031 | $7,027 |
| 2015 | $1,660 | $9,058 | $2,031 | $7,027 |
| 2014 | $1,522 | $8,204 | $1,875 | $6,329 |
| 2013 | $1,492 | $8,204 | $1,875 | $6,329 |
Source: Public Records
Map
Nearby Homes
- 7050 S Throop St
- 7041 S Throop St
- 7022 S Elizabeth St
- 7019 S Throop St
- 7042 S Racine Ave
- 1241 W 72nd Place
- 7144 S May St
- 6953 S Elizabeth St
- 6943 S Ada St
- 6953 S Loomis Blvd
- 6939 S Ada St
- 6944 S Racine Ave
- 7238 S May St
- 6946 S Loomis Blvd
- 7126 S Aberdeen St
- 7300 S Racine Ave
- 6929 S Loomis Blvd
- 1240 W 73rd Place
- 1500 W 71st St
- 6946 S May St
- 1280 W 71st Place
- 1274 W 71st Place
- 1270 W 71st Place
- 1268 W 71st Place
- 1264 W 71st Place
- 1279 W 71st St
- 1273 W 71st St
- 1281 W 71st St
- 1262 W 71st Place
- 1271 W 71st St
- 1267 W 71st St
- 1260 W 71st Place
- 1301 W 71st St
- 1265 W 71st St
- 1281 W 71st Place
- 1273 W 71st Place
- 1256 W 71st Place
- 1271 W 71st Place
- 1263 W 71st St
- 1310 W 71st Place Unit 2