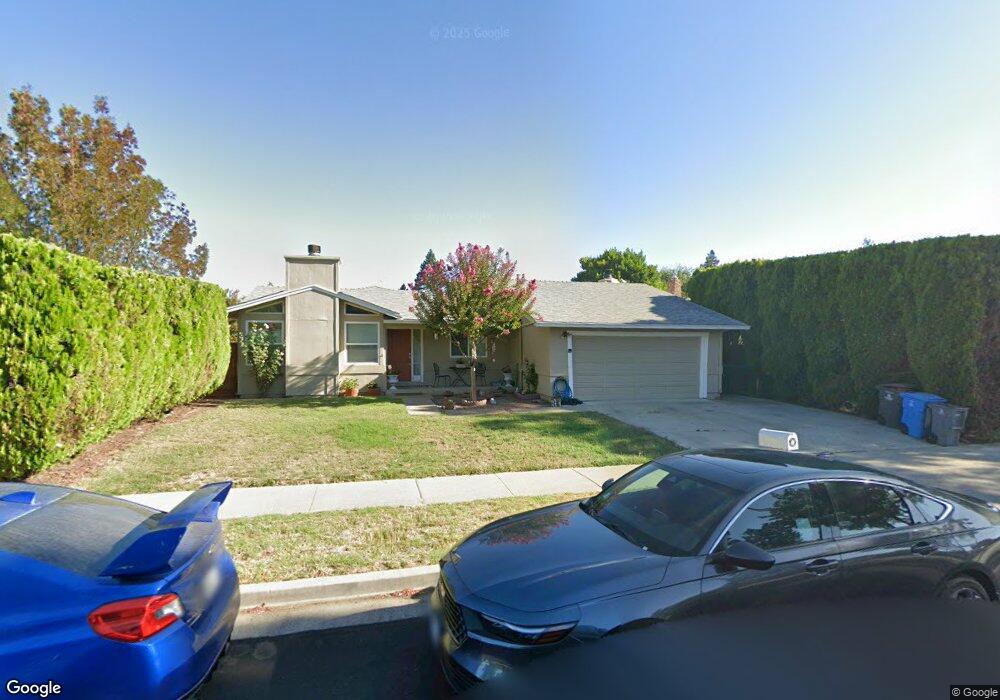
1279 Ayer Dr Gilroy, CA 95020
Estimated Value: $814,000 - $1,014,000
3
Beds
2
Baths
1,512
Sq Ft
$599/Sq Ft
Est. Value
About This Home
This home is located at 1279 Ayer Dr, Gilroy, CA 95020 and is currently estimated at $905,252, approximately $598 per square foot. 1279 Ayer Dr is a home located in Santa Clara County with nearby schools including El Roble Elementary School, Brownell Middle School, and Solorsano Middle School.
Ownership History
Date
Name
Owned For
Owner Type
Purchase Details
Closed on
Nov 12, 2008
Sold by
U S Bank Naitonal Association
Bought by
Steenhuis Juli A and Steenhuis John
Current Estimated Value
Purchase Details
Closed on
Jul 8, 2008
Sold by
Suarez Eliseo
Bought by
U S Bank Na
Purchase Details
Closed on
Apr 6, 2006
Sold by
Thaler James L
Bought by
Saurez Eliseo
Home Financials for this Owner
Home Financials are based on the most recent Mortgage that was taken out on this home.
Original Mortgage
$137,200
Interest Rate
6.29%
Mortgage Type
Stand Alone Second
Purchase Details
Closed on
Sep 26, 2002
Sold by
Thaler James L and Thaler Angela
Bought by
Thaler James L
Home Financials for this Owner
Home Financials are based on the most recent Mortgage that was taken out on this home.
Original Mortgage
$150,000
Interest Rate
6.22%
Create a Home Valuation Report for This Property
The Home Valuation Report is an in-depth analysis detailing your home's value as well as a comparison with similar homes in the area
Home Values in the Area
Average Home Value in this Area
Purchase History
| Date | Buyer | Sale Price | Title Company |
|---|---|---|---|
| Steenhuis Juli A | $330,000 | Lsi Title Agency | |
| U S Bank Na | $377,333 | Accommodation | |
| Saurez Eliseo | $686,000 | Alliance Title Company | |
| Thaler James L | -- | Stewart Title Of California |
Source: Public Records
Mortgage History
| Date | Status | Borrower | Loan Amount |
|---|---|---|---|
| Previous Owner | Saurez Eliseo | $137,200 | |
| Previous Owner | Thaler James L | $150,000 |
Source: Public Records
Tax History
| Year | Tax Paid | Tax Assessment Tax Assessment Total Assessment is a certain percentage of the fair market value that is determined by local assessors to be the total taxable value of land and additions on the property. | Land | Improvement |
|---|---|---|---|---|
| 2025 | $5,234 | $424,819 | $233,594 | $191,225 |
| 2024 | $5,234 | $416,490 | $229,014 | $187,476 |
| 2023 | $5,203 | $408,324 | $224,524 | $183,800 |
| 2022 | $5,117 | $400,319 | $220,122 | $180,197 |
| 2021 | $5,094 | $392,470 | $215,806 | $176,664 |
| 2020 | $5,038 | $388,447 | $213,594 | $174,853 |
| 2019 | $4,992 | $380,831 | $209,406 | $171,425 |
| 2018 | $4,663 | $373,364 | $205,300 | $168,064 |
| 2017 | $4,760 | $366,044 | $201,275 | $164,769 |
| 2016 | $4,661 | $358,868 | $197,329 | $161,539 |
| 2015 | $4,399 | $353,478 | $194,365 | $159,113 |
| 2014 | $4,371 | $346,555 | $190,558 | $155,997 |
Source: Public Records
Map
Nearby Homes
- 7609 Santa Paula Dr
- 1250 Driftwood Terrace
- 1330 Redwood Ln
- 1231 Juniper Dr Unit H
- 7902 English Oak Cir
- 7942 English Oak Cir
- 925 Blake Ct
- 7440 Carnoustie Ct
- 7490 Santa Theresa Dr Unit 10
- 1826 Club Dr
- 6389 Tawhana Ln
- 7821 Santa Theresa Dr
- 704 Tennyson Dr
- 8170 Westwood Dr Unit 22
- 7460 Miller Ave
- 0 California 152
- 8120 Catalina Ct
- 60 Monte Vista Way
- 7716 Oregano Way
- 1008 Primrose Ln
- 1289 Ayer Dr
- 1269 Ayer Dr
- 1250 San Miguel St
- 1259 Ayer Dr
- 1299 Ayer Dr
- 1240 San Miguel St
- 7580 Santa Barbara Dr
- 1230 San Miguel St Unit 4
- 7590 Santa Barbara Dr
- 1270 Ayer Dr
- 1249 Ayer Dr
- 1260 Ayer Dr
- 1280 Ayer Dr Unit 11
- 7550 Santa Barbara Dr
- 1250 Ayer Dr
- 1220 San Miguel St
- 1239 Ayer Dr
- 1240 Ayer Dr
- 7571 Santa Barbara Dr
- 7540 Santa Barbara Dr
Your Personal Tour Guide
Ask me questions while you tour the home.