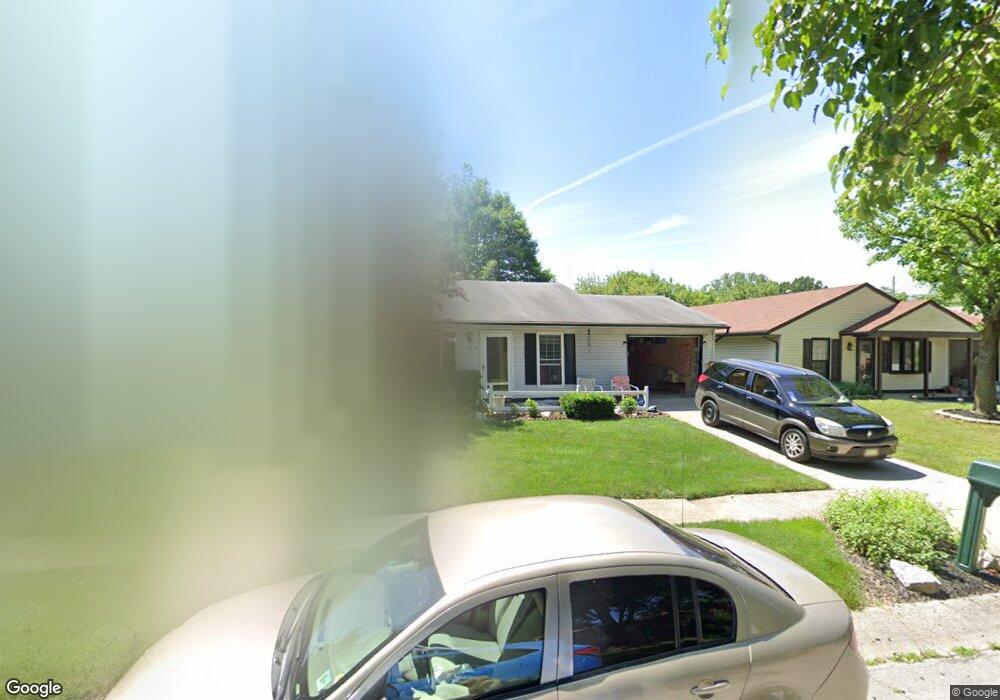
1279 Glen Cove Way Columbus, OH 43204
Brookhollow NeighborhoodEstimated Value: $214,000 - $231,000
2
Beds
1
Bath
936
Sq Ft
$238/Sq Ft
Est. Value
About This Home
This home is located at 1279 Glen Cove Way, Columbus, OH 43204 and is currently estimated at $223,200, approximately $238 per square foot. 1279 Glen Cove Way is a home located in Franklin County with nearby schools including Beacon Elementary School, Hilliard Tharp Sixth Grade Elementary School, and Hilliard Weaver Middle School.
Ownership History
Date
Name
Owned For
Owner Type
Purchase Details
Closed on
Nov 14, 2023
Sold by
Minshall Brad L
Bought by
Minshall Brad L and Harding Christopher
Current Estimated Value
Purchase Details
Closed on
Oct 24, 2023
Sold by
Minshall Brad L
Bought by
Minshall Brad L and Harding Christopher
Purchase Details
Closed on
Apr 11, 2001
Sold by
Leonardo Deborah K
Bought by
Minshall Brad L
Home Financials for this Owner
Home Financials are based on the most recent Mortgage that was taken out on this home.
Original Mortgage
$83,230
Interest Rate
7.05%
Mortgage Type
FHA
Purchase Details
Closed on
Nov 1, 1996
Sold by
Pasos Plutarco
Bought by
Deborah K Leonardo
Home Financials for this Owner
Home Financials are based on the most recent Mortgage that was taken out on this home.
Original Mortgage
$68,400
Interest Rate
8.23%
Mortgage Type
FHA
Purchase Details
Closed on
Nov 30, 1993
Purchase Details
Closed on
Oct 1, 1983
Create a Home Valuation Report for This Property
The Home Valuation Report is an in-depth analysis detailing your home's value as well as a comparison with similar homes in the area
Home Values in the Area
Average Home Value in this Area
Purchase History
| Date | Buyer | Sale Price | Title Company |
|---|---|---|---|
| Minshall Brad L | -- | None Listed On Document | |
| Minshall Brad L | -- | None Listed On Document | |
| Minshall Brad L | $83,900 | Premium Title Inc | |
| Deborah K Leonardo | $69,900 | -- | |
| -- | $62,000 | -- | |
| -- | -- | -- |
Source: Public Records
Mortgage History
| Date | Status | Borrower | Loan Amount |
|---|---|---|---|
| Previous Owner | Minshall Brad L | $83,230 | |
| Previous Owner | Deborah K Leonardo | $68,400 |
Source: Public Records
Tax History Compared to Growth
Tax History
| Year | Tax Paid | Tax Assessment Tax Assessment Total Assessment is a certain percentage of the fair market value that is determined by local assessors to be the total taxable value of land and additions on the property. | Land | Improvement |
|---|---|---|---|---|
| 2024 | $3,849 | $68,150 | $30,310 | $37,840 |
| 2023 | $3,334 | $68,150 | $30,310 | $37,840 |
| 2022 | $2,393 | $39,170 | $13,510 | $25,660 |
| 2021 | $2,391 | $39,170 | $13,510 | $25,660 |
| 2020 | $2,384 | $39,170 | $13,510 | $25,660 |
| 2019 | $2,213 | $31,050 | $10,820 | $20,230 |
| 2018 | $2,167 | $31,050 | $10,820 | $20,230 |
| 2017 | $2,204 | $31,050 | $10,820 | $20,230 |
| 2016 | $2,273 | $29,650 | $8,330 | $21,320 |
| 2015 | $2,130 | $29,650 | $8,330 | $21,320 |
| 2014 | $2,134 | $29,650 | $8,330 | $21,320 |
| 2013 | $1,081 | $29,645 | $8,330 | $21,315 |
Source: Public Records
Map
Nearby Homes
- 4000 Sandy Ridge Dr
- 3761 Gibbstone Dr
- 3757 Gibbstone Dr
- 3664 Grimes Dr
- 3570 Dover Rd
- 3495 La Coste Ln
- 3254 Dover Rd
- 3252 Dover Rd
- 4457 Nickerson Rd
- 4451 Sherwill Rd
- 1150 Romona Place
- 0 Lowell Dr Unit 223009270
- 1175 Onaway Ct
- 664 N Wilson Rd
- 3161 Bowdoin Cir
- 2051 Tuckaway Ct
- 3307 Rudon Ln
- 2875 Lowell Dr
- 4589 Annhurst Rd
- 355-357 N Algonquin Ave
- 1287 Glen Cove Way
- 1271 Glen Cove Way
- 1295 Glen Cove Way
- 1263 Glen Cove Way
- 1288 Deer Lake Ct
- 1303 Glen Cove Way
- 1255 Glen Cove Way
- 1280 Deer Lake Ct
- 1276 Glen Cove Way
- 1270 Glen Cove Way
- 1311 Glen Cove Way
- 1284 Glen Cove Way
- 1264 Glen Cove Way
- 1296 Deer Lake Ct
- 1264 Deer Lake Ct
- 1292 Glen Cove Way
- 1258 Glen Cove Way
- 1247 Glen Cove Way
- 3930 Deer Lake Way
- 3938 Deer Lake Way