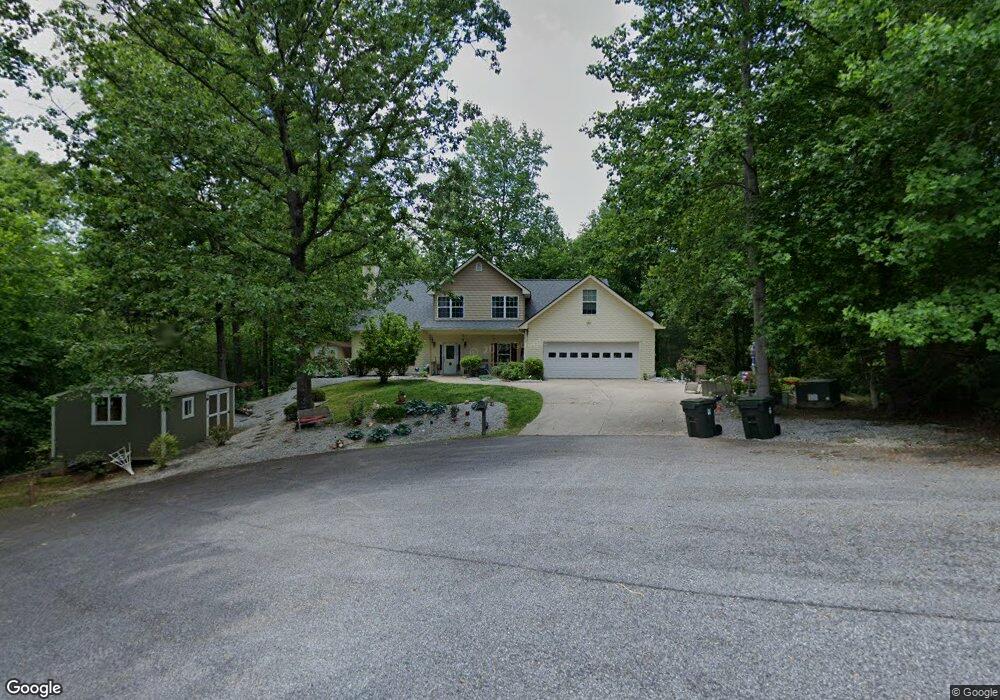
128 Collier Mill Rd Toccoa, GA 30577
Estimated Value: $384,000 - $414,000
4
Beds
3
Baths
2,446
Sq Ft
$162/Sq Ft
Est. Value
About This Home
This home is located at 128 Collier Mill Rd, Toccoa, GA 30577 and is currently estimated at $396,510, approximately $162 per square foot. 128 Collier Mill Rd is a home located in Stephens County with nearby schools including Stephens County High School.
Ownership History
Date
Name
Owned For
Owner Type
Purchase Details
Closed on
May 11, 2018
Sold by
Malek Sherif
Bought by
Malek Elvira
Current Estimated Value
Purchase Details
Closed on
Jun 5, 2008
Sold by
Ajf Construction Inc
Bought by
Halm Abner Wayne and Halm Patricia Anne
Purchase Details
Closed on
Apr 24, 2008
Sold by
Ajf Construction Inc
Bought by
Fedorchak David C and Fedorchak Lisa M
Purchase Details
Closed on
Jul 2, 2007
Sold by
Ajf Construction Inc
Bought by
Malek Sherif
Purchase Details
Closed on
May 18, 2007
Sold by
Gosnell Cynthia Morgan
Bought by
Gosnell Mark David
Purchase Details
Closed on
May 1, 2007
Sold by
Ajf Construction Inc
Bought by
De Jac Inc
Purchase Details
Closed on
Apr 27, 2007
Sold by
Not Provided
Bought by
Malek Sherif and Malek Elvira
Purchase Details
Closed on
Oct 19, 2006
Sold by
Watson Bette C
Bought by
Ajf Construction Inc
Create a Home Valuation Report for This Property
The Home Valuation Report is an in-depth analysis detailing your home's value as well as a comparison with similar homes in the area
Purchase History
| Date | Buyer | Sale Price | Title Company |
|---|---|---|---|
| Malek Elvira | -- | -- | |
| Halm Abner Wayne | $200,000 | -- | |
| Fedorchak David C | $226,000 | -- | |
| Malek Sherif | $220,000 | -- | |
| Gosnell Mark David | -- | -- | |
| De Jac Inc | $22,000 | -- | |
| Malek Sherif | $185,000 | -- | |
| Gosnell Mark David | $185,000 | -- | |
| Ajf Construction Inc | $98,000 | -- | |
| Ajf Construction Inc | $98,000 | -- |
Source: Public Records
Tax History
| Year | Tax Paid | Tax Assessment Tax Assessment Total Assessment is a certain percentage of the fair market value that is determined by local assessors to be the total taxable value of land and additions on the property. | Land | Improvement |
|---|---|---|---|---|
| 2025 | $3,554 | $149,887 | $4,775 | $145,112 |
| 2024 | $3,440 | $98,194 | $4,775 | $93,419 |
| 2023 | $3,169 | $91,285 | $4,775 | $86,510 |
| 2022 | $2,527 | $86,880 | $4,775 | $82,105 |
| 2021 | $2,454 | $80,473 | $4,775 | $75,698 |
| 2020 | $2,447 | $79,499 | $4,775 | $74,724 |
| 2019 | $2,403 | $77,769 | $4,775 | $72,994 |
| 2018 | $2,403 | $77,769 | $4,775 | $72,994 |
| 2017 | $2,441 | $77,769 | $4,775 | $72,994 |
| 2016 | $2,403 | $77,768 | $4,774 | $72,994 |
| 2015 | $2,583 | $77,768 | $4,774 | $72,994 |
| 2014 | $2,668 | $79,021 | $4,775 | $74,246 |
| 2013 | -- | $79,824 | $4,774 | $75,049 |
Source: Public Records
Map
Nearby Homes
- 0 E Currahee St Unit 10544607
- 297 Ayers Creek Dr
- 327 Ayers Creek Dr
- 668 Brookdale Rd
- 1292 Fernside Dr
- 110 Valley Rd
- 81 Boulder Dr
- 148 Moreland Dr
- 694 Lovers Ln
- 593 Cross Creek Dr
- 29 Mountain View Dr
- 281 Line Rd
- 43 Mountain View Dr
- 117 Glencrest Dr
- 0 Brookhaven Cir Unit 10616964
- 45 Hayes St
- 337 Rock Creek Rd
- 0 Hwy 17 Alt Unit 10577119
- 998 Rosedale St
- 1168 Rosedale St
- 78 Collier Mill Rd
- 0 Collier Mill Rd Unit LOT7 7296376
- 0 Collier Mill Rd Unit LOT5 7296384
- 0 Collier Mill Rd Unit LOT8 7296375
- 0 Collier Mill Rd Unit 7,8 8168439
- 0 Collier Mill Rd Unit 5 8168403
- 63 Collier Mill Rd
- 54 Collier Mill Rd
- 756 Fernside Dr
- 662 Fernside Dr
- 592 Fernside Dr
- 640 Fernside Dr
- 38 Collier Mill Rd
- 187 Fern Valley Cir
- 486 Fernside Dr
- 153 Fern Valley Cir
- 100 Wesley Dr
- 110 Fern Valley Cir
- 18 Wesley Cir
- 68 Fern Valley Cir
Your Personal Tour Guide
Ask me questions while you tour the home.