128 Gravatt Dr Berkeley, CA 94705
Claremont Hills NeighborhoodEstimated Value: $2,208,196 - $2,417,000
4
Beds
4
Baths
3,920
Sq Ft
$598/Sq Ft
Est. Value
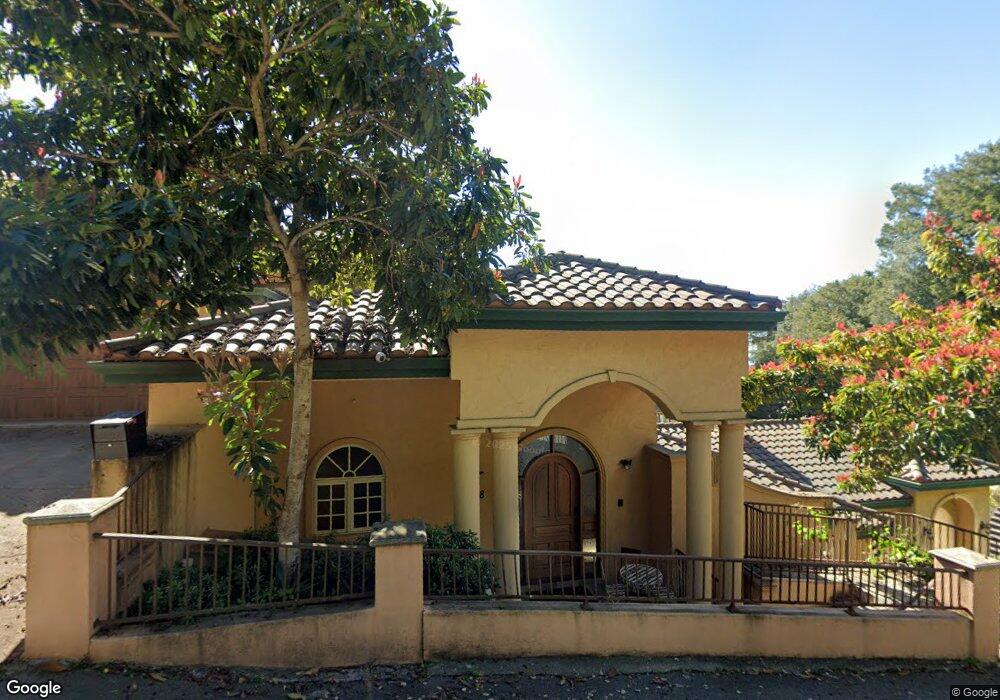
About This Home
This home is located at 128 Gravatt Dr, Berkeley, CA 94705 and is currently estimated at $2,344,549, approximately $598 per square foot. 128 Gravatt Dr is a home located in Alameda County with nearby schools including Chabot Elementary School, Thornhill Elementary School, and Claremont Middle School.
Ownership History
Date
Name
Owned For
Owner Type
Purchase Details
Closed on
Aug 30, 2019
Sold by
Wong Laura Hom
Bought by
Wong Laura Hom and Wong Oak Hom
Current Estimated Value
Purchase Details
Closed on
Feb 22, 2007
Sold by
Wong Laura Home
Bought by
Wong Laura Hom
Home Financials for this Owner
Home Financials are based on the most recent Mortgage that was taken out on this home.
Original Mortgage
$1,680,000
Outstanding Balance
$1,025,133
Interest Rate
6.5%
Mortgage Type
New Conventional
Estimated Equity
$1,319,416
Purchase Details
Closed on
Mar 12, 2004
Sold by
Montgomery Holding Inc
Bought by
Wong Laura Hom
Purchase Details
Closed on
Nov 26, 2003
Sold by
Hom Oak S
Bought by
Wong Laura Hom
Home Financials for this Owner
Home Financials are based on the most recent Mortgage that was taken out on this home.
Original Mortgage
$855,511
Interest Rate
4.62%
Mortgage Type
Purchase Money Mortgage
Create a Home Valuation Report for This Property
The Home Valuation Report is an in-depth analysis detailing your home's value as well as a comparison with similar homes in the area
Home Values in the Area
Average Home Value in this Area
Purchase History
| Date | Buyer | Sale Price | Title Company |
|---|---|---|---|
| Wong Laura Hom | -- | None Available | |
| Wong Laura Hom | -- | Commonwealth Land Title | |
| Wong Laura Hom | $100,000 | -- | |
| Wong Laura Hom | -- | -- |
Source: Public Records
Mortgage History
| Date | Status | Borrower | Loan Amount |
|---|---|---|---|
| Open | Wong Laura Hom | $1,680,000 | |
| Previous Owner | Wong Laura Hom | $855,511 |
Source: Public Records
Tax History
| Year | Tax Paid | Tax Assessment Tax Assessment Total Assessment is a certain percentage of the fair market value that is determined by local assessors to be the total taxable value of land and additions on the property. | Land | Improvement |
|---|---|---|---|---|
| 2025 | $26,356 | $1,972,449 | $639,769 | $1,339,680 |
| 2024 | $26,356 | $1,933,648 | $627,228 | $1,313,420 |
| 2023 | $27,917 | $1,902,599 | $614,929 | $1,287,670 |
| 2022 | $27,390 | $1,858,304 | $602,874 | $1,262,430 |
| 2021 | $26,614 | $1,821,737 | $591,057 | $1,237,680 |
| 2020 | $26,318 | $1,809,990 | $585,000 | $1,224,990 |
| 2019 | $25,566 | $1,774,509 | $573,529 | $1,200,980 |
| 2018 | $25,015 | $1,739,724 | $562,284 | $1,177,440 |
| 2017 | $24,138 | $1,705,619 | $551,259 | $1,154,360 |
| 2016 | $23,689 | $1,672,180 | $540,450 | $1,131,730 |
| 2015 | $23,686 | $1,647,072 | $532,332 | $1,114,740 |
| 2014 | $24,051 | $1,614,815 | $521,905 | $1,092,910 |
Source: Public Records
Map
Nearby Homes
- 0 Gravatt Dr Unit 41122154
- 2 Gravatt Dr
- 142 Gravatt Dr
- 260 Alvarado Rd
- 641 Alvarado Rd
- 150 Vicente Rd
- 1488 Alvarado Rd
- 29 Live Oak Rd
- 190 Stonewall Rd
- 1102 Grand View Dr
- 1426 Grand View Dr
- 0 Dartmouth Dr
- 0 Tunnel Rd
- 7723 Claremont Ave
- 1215 Alvarado Rd
- 204 El Camino Real
- 1375 Alvarado Rd
- 1383 Alvarado Rd
- 0 Gypsy Ln
- 7041 Devon Way
Your Personal Tour Guide
Ask me questions while you tour the home.