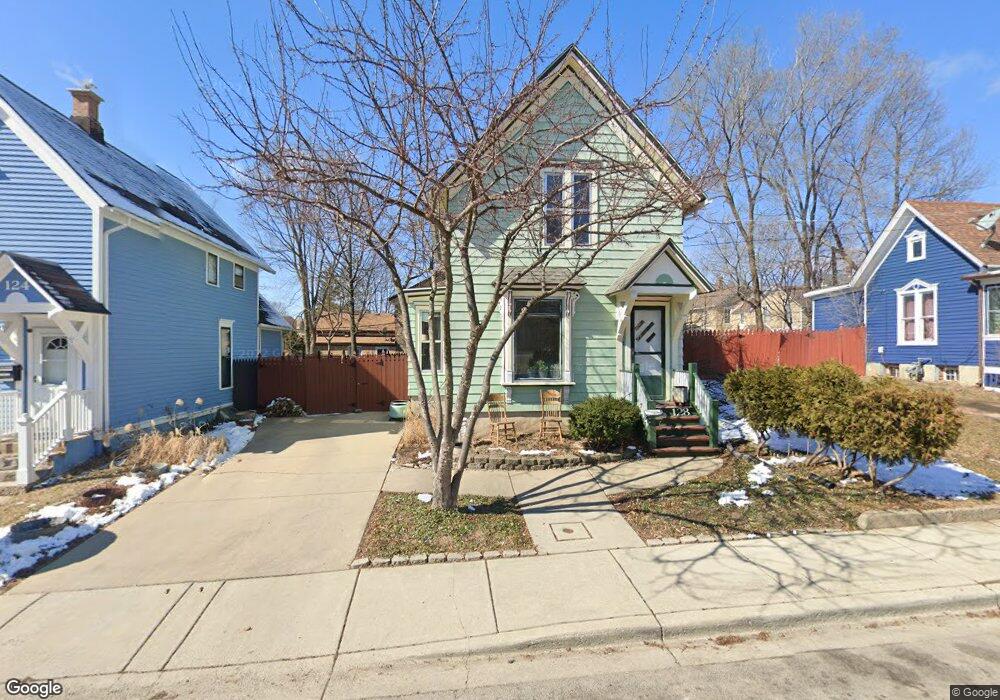
128 Hinsdell Place Elgin, IL 60120
Gifford Park NeighborhoodEstimated Value: $207,000 - $247,232
3
Beds
2
Baths
1,212
Sq Ft
$190/Sq Ft
Est. Value
About This Home
This home is located at 128 Hinsdell Place, Elgin, IL 60120 and is currently estimated at $230,308, approximately $190 per square foot. 128 Hinsdell Place is a home located in Kane County with nearby schools including Ronald D O'Neal Elementary School, Ellis Middle School, and Elgin High School.
Ownership History
Date
Name
Owned For
Owner Type
Purchase Details
Closed on
Jun 23, 2004
Sold by
Barnett Shelley R Z
Bought by
Kendzy Kenneth A
Current Estimated Value
Home Financials for this Owner
Home Financials are based on the most recent Mortgage that was taken out on this home.
Original Mortgage
$144,400
Interest Rate
6.08%
Mortgage Type
Purchase Money Mortgage
Purchase Details
Closed on
Dec 28, 2000
Sold by
Piraino Marie
Bought by
Barnett Shelley R Z
Home Financials for this Owner
Home Financials are based on the most recent Mortgage that was taken out on this home.
Original Mortgage
$127,775
Interest Rate
7.8%
Purchase Details
Closed on
Jul 24, 2000
Sold by
Aames Capital Corp
Bought by
Piraino Marie
Purchase Details
Closed on
Jan 7, 2000
Sold by
Reid Thomas W and Reid Paulette
Bought by
Aames Capital Corp
Create a Home Valuation Report for This Property
The Home Valuation Report is an in-depth analysis detailing your home's value as well as a comparison with similar homes in the area
Home Values in the Area
Average Home Value in this Area
Purchase History
| Date | Buyer | Sale Price | Title Company |
|---|---|---|---|
| Kendzy Kenneth A | $152,000 | Atg | |
| Barnett Shelley R Z | $134,500 | -- | |
| Piraino Marie | $50,000 | First American Title Ins Co | |
| Aames Capital Corp | -- | -- |
Source: Public Records
Mortgage History
| Date | Status | Borrower | Loan Amount |
|---|---|---|---|
| Previous Owner | Kendzy Kenneth A | $144,400 | |
| Previous Owner | Barnett Shelley R Z | $127,775 |
Source: Public Records
Tax History Compared to Growth
Tax History
| Year | Tax Paid | Tax Assessment Tax Assessment Total Assessment is a certain percentage of the fair market value that is determined by local assessors to be the total taxable value of land and additions on the property. | Land | Improvement |
|---|---|---|---|---|
| 2024 | $3,869 | $56,340 | $7,271 | $49,069 |
| 2023 | $3,657 | $50,899 | $6,569 | $44,330 |
| 2022 | $3,504 | $46,411 | $5,990 | $40,421 |
| 2021 | $3,336 | $43,391 | $5,600 | $37,791 |
| 2020 | $3,074 | $39,705 | $5,346 | $34,359 |
| 2019 | $2,972 | $37,821 | $5,092 | $32,729 |
| 2018 | $2,698 | $33,294 | $4,797 | $28,497 |
| 2017 | $2,620 | $31,475 | $4,535 | $26,940 |
| 2016 | $2,474 | $29,200 | $4,207 | $24,993 |
| 2015 | -- | $26,764 | $3,856 | $22,908 |
| 2014 | -- | $26,433 | $3,808 | $22,625 |
| 2013 | -- | $31,228 | $3,908 | $27,320 |
Source: Public Records
Map
Nearby Homes
- 370 North St
- 117 Tennyson Ct
- 453 Addison St
- 8 Walker Place
- 481 Division St
- 144 Hill Ave
- 419 Fremont St
- 428 Fremont St
- 216 Prairie St
- 281 Gifford Place
- 277 Gifford Place
- 650 Park St
- 217 Henry St
- 407 N Liberty St
- 376 Jefferson Ave
- 409 Algona Ave
- 602 Prospect St
- 96 S Crystal St
- 262 Bartlett Place
- 764 Terrace Ct Unit A
- 124 Hinsdell Place
- 132 Hinsdell Place
- 118 Hinsdell Place
- 127 N Gifford St Unit 129
- 131 N Gifford St
- 134 Hinsdell Place
- 121 N Gifford St
- 137 N Gifford St
- 409 North St
- 413 North St
- 121 Hinsdell Place Unit 23
- 121 Hinsdell Place Unit 3S
- 121 Hinsdell Place Unit 3N
- 121 Hinsdell Place Unit 2S
- 121 Hinsdell Place Unit 2N
- 121 Hinsdell Place Unit 1N
- 125 Hinsdell Place
- 133 Hinsdell Place
- 141 Hinsdell Place Unit 3
- 141 Hinsdell Place