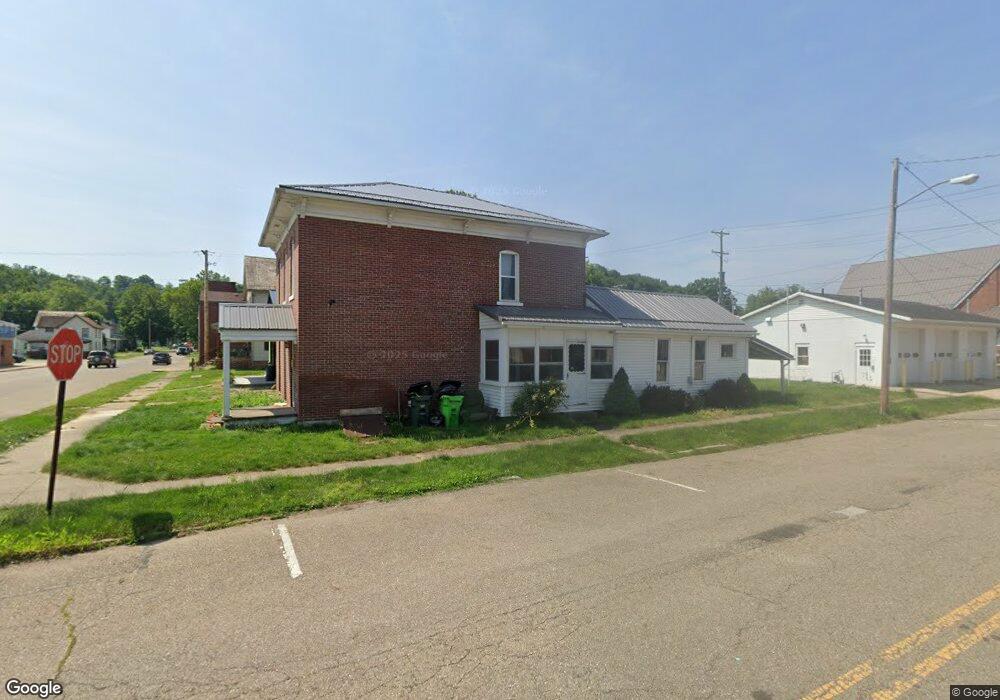
128 N Dawson St Uhrichsville, OH 44683
Estimated Value: $126,000 - $135,000
4
Beds
3
Baths
1,744
Sq Ft
$74/Sq Ft
Est. Value
About This Home
This home is located at 128 N Dawson St, Uhrichsville, OH 44683 and is currently estimated at $129,333, approximately $74 per square foot. 128 N Dawson St is a home located in Tuscarawas County with nearby schools including Claymont High School and Immaculate Conception School.
Ownership History
Date
Name
Owned For
Owner Type
Purchase Details
Closed on
Jun 3, 2021
Sold by
R L Smith Realty Ltd
Bought by
Investment Source Ltd
Current Estimated Value
Purchase Details
Closed on
Jun 27, 2003
Sold by
Swigert Lester L
Bought by
R L Smith Realty Ltd
Home Financials for this Owner
Home Financials are based on the most recent Mortgage that was taken out on this home.
Original Mortgage
$110,000
Interest Rate
5.75%
Mortgage Type
Purchase Money Mortgage
Purchase Details
Closed on
Dec 29, 1997
Sold by
Ronald Bruce E
Bought by
Swigert Lester L and Swigert Keely R
Home Financials for this Owner
Home Financials are based on the most recent Mortgage that was taken out on this home.
Original Mortgage
$41,900
Interest Rate
8.25%
Mortgage Type
New Conventional
Purchase Details
Closed on
May 22, 1991
Sold by
Leidner Thomas H
Bought by
Ronald Bruce E and Ronald Sally J
Create a Home Valuation Report for This Property
The Home Valuation Report is an in-depth analysis detailing your home's value as well as a comparison with similar homes in the area
Home Values in the Area
Average Home Value in this Area
Purchase History
| Date | Buyer | Sale Price | Title Company |
|---|---|---|---|
| Investment Source Ltd | $101,000 | Alban Title | |
| Investment Source Ltd | -- | Alban Title | |
| R L Smith Realty Ltd | $74,000 | -- | |
| Swigert Lester L | $45,000 | -- | |
| Ronald Bruce E | $19,500 | -- |
Source: Public Records
Mortgage History
| Date | Status | Borrower | Loan Amount |
|---|---|---|---|
| Previous Owner | R L Smith Realty Ltd | $110,000 | |
| Previous Owner | Swigert Lester L | $41,900 |
Source: Public Records
Tax History Compared to Growth
Tax History
| Year | Tax Paid | Tax Assessment Tax Assessment Total Assessment is a certain percentage of the fair market value that is determined by local assessors to be the total taxable value of land and additions on the property. | Land | Improvement |
|---|---|---|---|---|
| 2024 | $1,284 | $34,650 | $1,900 | $32,750 |
| 2023 | $1,284 | $99,000 | $5,440 | $93,560 |
| 2022 | $1,287 | $34,650 | $1,904 | $32,746 |
| 2021 | $1,226 | $29,338 | $1,600 | $27,738 |
| 2020 | $1,250 | $29,338 | $1,600 | $27,738 |
| 2019 | $1,160 | $29,338 | $1,600 | $27,738 |
| 2018 | $1,081 | $25,120 | $1,370 | $23,750 |
| 2017 | $1,082 | $25,120 | $1,370 | $23,750 |
| 2016 | $1,024 | $25,120 | $1,370 | $23,750 |
| 2014 | $1,174 | $26,520 | $1,350 | $25,170 |
| 2013 | $1,180 | $26,520 | $1,350 | $25,170 |
Source: Public Records
Map
Nearby Homes