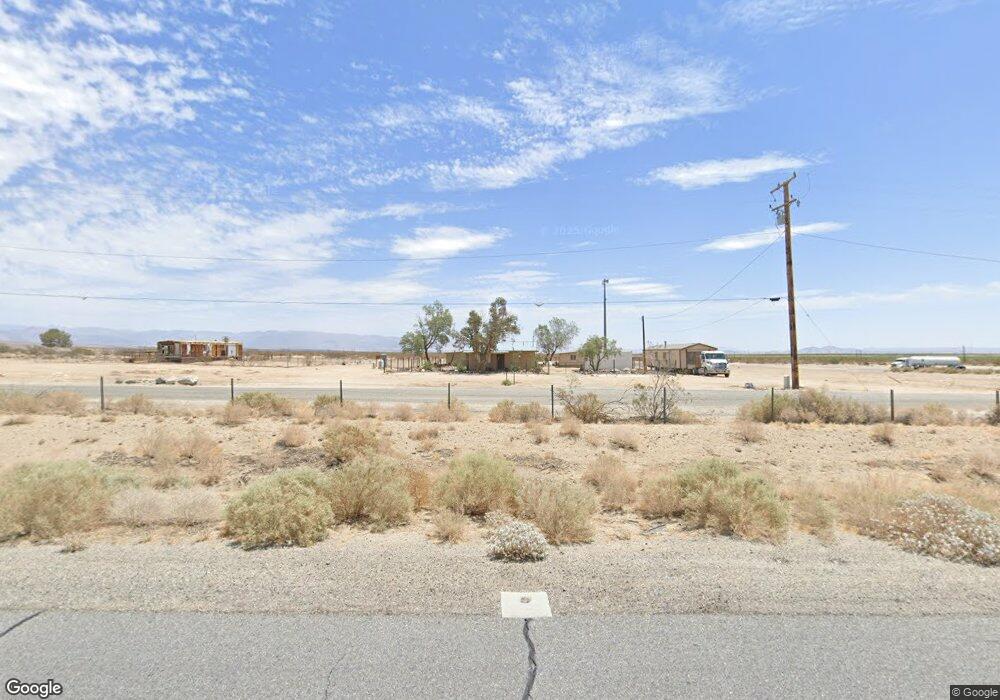
128 Pearson Rd Pearsonville, CA 93527
Estimated Value: $177,000 - $370,000
2
Beds
2
Baths
1,258
Sq Ft
$190/Sq Ft
Est. Value
About This Home
This home is located at 128 Pearson Rd, Pearsonville, CA 93527 and is currently estimated at $239,433, approximately $190 per square foot. 128 Pearson Rd is a home located in Inyo County with nearby schools including Lo-Inyo Elementary School and Lone Pine High School.
Ownership History
Date
Name
Owned For
Owner Type
Purchase Details
Closed on
Jan 18, 2024
Sold by
Donald And Diana Jo Pearson 2006 Trust
Bought by
Garrison Ronnie Gordon and Garrison Hongfeng
Current Estimated Value
Home Financials for this Owner
Home Financials are based on the most recent Mortgage that was taken out on this home.
Original Mortgage
$155,000
Interest Rate
6.6%
Mortgage Type
New Conventional
Purchase Details
Closed on
Dec 30, 2020
Sold by
Pearson Diana Jo and Donald And Diana Jo Pearson 20
Bought by
Pearson Diana Jo and Donald And Diana Jo Pearson 20
Purchase Details
Closed on
Jun 26, 2017
Sold by
Sba Structures Llc
Bought by
Pearson Diana Jo
Purchase Details
Closed on
Jun 15, 2007
Sold by
Pearson Diana Jo
Bought by
Pearson Diana Jo
Purchase Details
Closed on
Jan 12, 2006
Sold by
Pearson Donald and Pearson Diana Jo
Bought by
Pearson Donald and Pearson Diana Jo
Create a Home Valuation Report for This Property
The Home Valuation Report is an in-depth analysis detailing your home's value as well as a comparison with similar homes in the area
Purchase History
| Date | Buyer | Sale Price | Title Company |
|---|---|---|---|
| Garrison Ronnie Gordon | $175,000 | Inyo-Mono Title | |
| Pearson Diana Jo | -- | None Available | |
| Pearson Diana Jo | -- | Inyo Mono Title Company | |
| Pearson Diana Jo | -- | None Available | |
| Pearson Donald | -- | None Available |
Source: Public Records
Mortgage History
| Date | Status | Borrower | Loan Amount |
|---|---|---|---|
| Previous Owner | Garrison Ronnie Gordon | $155,000 |
Source: Public Records
Tax History
| Year | Tax Paid | Tax Assessment Tax Assessment Total Assessment is a certain percentage of the fair market value that is determined by local assessors to be the total taxable value of land and additions on the property. | Land | Improvement |
|---|---|---|---|---|
| 2025 | $1,539 | $178,500 | $102,000 | $76,500 |
| 2024 | $1,371 | $122,145 | $85,931 | $36,214 |
| 2023 | $1,348 | $119,751 | $84,247 | $35,504 |
| 2022 | $1,301 | $117,404 | $82,596 | $34,808 |
| 2021 | $1,301 | $115,103 | $80,977 | $34,126 |
| 2020 | $1,267 | $113,924 | $80,147 | $33,777 |
| 2019 | $633 | $111,691 | $78,576 | $33,115 |
| 2018 | $1,245 | $109,502 | $77,036 | $32,466 |
| 2017 | $1,224 | $107,356 | $75,526 | $31,830 |
| 2016 | $1,203 | $105,252 | $74,046 | $31,206 |
| 2015 | $1,187 | $103,672 | $72,934 | $30,738 |
| 2014 | $1,097 | $101,727 | $65,733 | $35,994 |
Source: Public Records
Map
Nearby Homes
- 0 Pearson Rd
- 0 Apn 056-071-39 Onyx Peak
- 11 Sterling Rd
- 9000 Brown Rd
- 8333 Paradise Cove Ave
- 7920 Neal Ranch Rd
- 8085 Neal Ranch Rd
- 0 Greasewood Ave Unit 56-34
- 0 Quail St
- 49901 Hwy 14
- 4708 Hawk St
- 7380 Siebenthal
- 064-480-08 Solo
- 6749 Blackjack
- 352-530-01 Owens Peak
- 0 Buckel N Brown Rd
- 663 Bull Run St
- 064-310-49 Quail St
- 056-252-1 Tumbleweed St
- 3443 Third St
- 102 Pearson Rd
- 1 Sterling Rd
- 3 Sterling Rd
- 9508 Hwy 395
- 056--71-02 Pearson Rd
- 037-220-15 Pearson Rd
- 401 Sterling Rd
- 0 Hwy 395 @ Inyo County Border Unit 19007256
- 0 395 of Hwy
- 97953 Cottonwood Rd
- 0 Pearsonville Rd Unit 20005881
- 861 Sterling Rd Unit n/a
- 861 Sterling Rd
- 1041A Sterling Rd
- Lot9 Hwy 395 Unit 9
- Lot9 Hwy 395
- 9 U S 395
- 1067 Sterling Rd
Your Personal Tour Guide
Ask me questions while you tour the home.