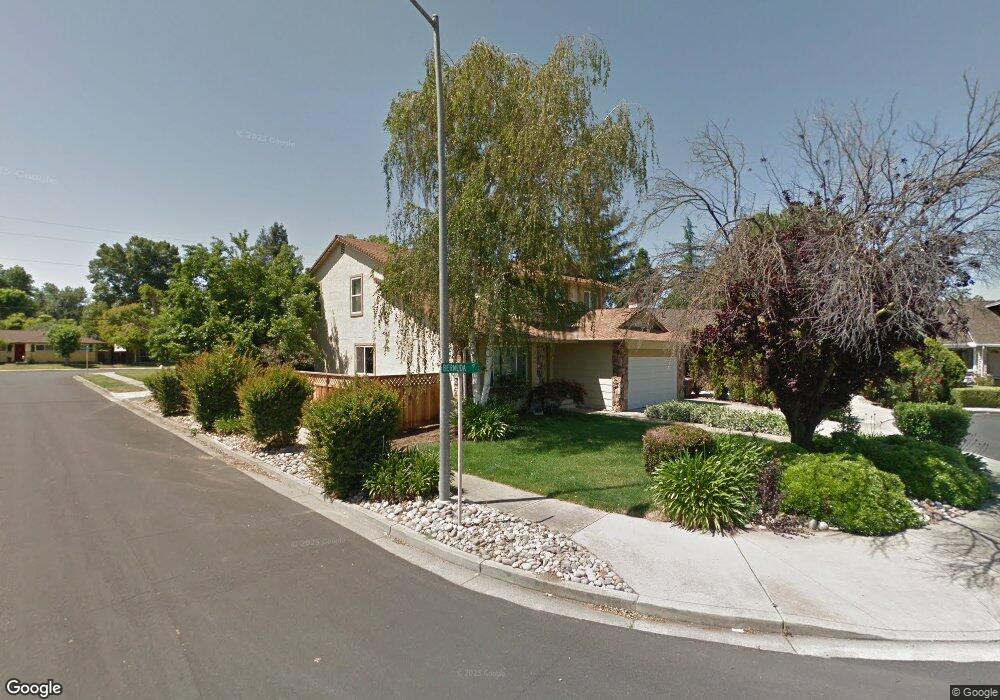
1280 Bermuda Ct Concord, CA 94518
Colony Park NeighborhoodEstimated Value: $936,000 - $1,366,000
4
Beds
3
Baths
2,225
Sq Ft
$497/Sq Ft
Est. Value
About This Home
This home is located at 1280 Bermuda Ct, Concord, CA 94518 and is currently estimated at $1,105,907, approximately $497 per square foot. 1280 Bermuda Ct is a home located in Contra Costa County with nearby schools including Fair Oaks Elementary School, Pleasant Hill Middle School, and Ygnacio Valley High School.
Ownership History
Date
Name
Owned For
Owner Type
Purchase Details
Closed on
Apr 2, 2019
Sold by
Railton George E and Jenkins Sharon E
Bought by
Railton Jenkins 2019 Community Prop Tr
Current Estimated Value
Home Financials for this Owner
Home Financials are based on the most recent Mortgage that was taken out on this home.
Original Mortgage
$250,000
Outstanding Balance
$217,978
Interest Rate
4.2%
Mortgage Type
New Conventional
Estimated Equity
$887,929
Purchase Details
Closed on
Sep 6, 2018
Sold by
Delima Kevin and Delima Mark
Bought by
Jenkins Sharon and Railton George E
Home Financials for this Owner
Home Financials are based on the most recent Mortgage that was taken out on this home.
Original Mortgage
$450,000
Outstanding Balance
$390,046
Interest Rate
4.6%
Mortgage Type
New Conventional
Estimated Equity
$715,861
Purchase Details
Closed on
Feb 20, 2013
Sold by
Gooch Adam L
Bought by
Delima Kevin and Delima Mark
Home Financials for this Owner
Home Financials are based on the most recent Mortgage that was taken out on this home.
Original Mortgage
$448,725
Interest Rate
3.34%
Mortgage Type
FHA
Purchase Details
Closed on
Feb 15, 2013
Sold by
Lotesta Lorren P
Bought by
Ammann Brad
Home Financials for this Owner
Home Financials are based on the most recent Mortgage that was taken out on this home.
Original Mortgage
$448,725
Interest Rate
3.34%
Mortgage Type
FHA
Purchase Details
Closed on
Nov 28, 2012
Sold by
Pinney Terry M and Pinney Christine A
Bought by
Gooch Retirement Plan Trust
Purchase Details
Closed on
Sep 29, 2006
Sold by
Pinney Terry M
Bought by
Pinney Christine A
Home Financials for this Owner
Home Financials are based on the most recent Mortgage that was taken out on this home.
Original Mortgage
$553,500
Interest Rate
6.53%
Mortgage Type
Stand Alone Refi Refinance Of Original Loan
Purchase Details
Closed on
Jul 7, 2006
Sold by
Pinney Anna M
Bought by
Pinney Terry M
Purchase Details
Closed on
Mar 31, 1994
Sold by
Russell Randal W and Javete Russell Robyn
Bought by
Pinney Terry M and Pinney Christine A
Home Financials for this Owner
Home Financials are based on the most recent Mortgage that was taken out on this home.
Original Mortgage
$271,800
Interest Rate
7.38%
Mortgage Type
Purchase Money Mortgage
Create a Home Valuation Report for This Property
The Home Valuation Report is an in-depth analysis detailing your home's value as well as a comparison with similar homes in the area
Home Values in the Area
Average Home Value in this Area
Purchase History
| Date | Buyer | Sale Price | Title Company |
|---|---|---|---|
| Railton Jenkins 2019 Community Prop Tr | -- | None Available | |
| Railton George E | -- | None Available | |
| Jenkins Sharon | $850,000 | Westminster Title Company | |
| Delima Kevin | $465,000 | Old Republic Title Company | |
| Ammann Brad | -- | Old Republic Title Company | |
| Gooch Adam | -- | Old Republic Title Company | |
| Gooch Retirement Plan Trust | $455,000 | Lawyers Title Company | |
| Pinney Christine A | -- | None Available | |
| Pinney Terry M | -- | Old Republic Title Company | |
| Pinney Terry M | -- | Old Republic Title Company | |
| Pinney Terry M | $302,000 | Fidelity Natl Title Co |
Source: Public Records
Mortgage History
| Date | Status | Borrower | Loan Amount |
|---|---|---|---|
| Open | Railton Jenkins 2019 Community Prop Tr | $250,000 | |
| Open | Jenkins Sharon | $450,000 | |
| Previous Owner | Delima Kevin | $448,725 | |
| Previous Owner | Pinney Terry M | $553,500 | |
| Previous Owner | Pinney Terry M | $271,800 |
Source: Public Records
Tax History
| Year | Tax Paid | Tax Assessment Tax Assessment Total Assessment is a certain percentage of the fair market value that is determined by local assessors to be the total taxable value of land and additions on the property. | Land | Improvement |
|---|---|---|---|---|
| 2025 | $11,298 | $948,187 | $577,279 | $370,908 |
| 2024 | $11,036 | $929,596 | $565,960 | $363,636 |
| 2023 | $10,858 | $911,369 | $554,863 | $356,506 |
| 2022 | $10,763 | $893,500 | $543,984 | $349,516 |
| 2021 | $10,524 | $875,981 | $533,318 | $342,663 |
| 2019 | $10,305 | $850,000 | $517,500 | $332,500 |
| 2018 | $6,996 | $562,770 | $308,442 | $254,328 |
| 2017 | $6,772 | $551,737 | $302,395 | $249,342 |
| 2016 | $6,608 | $540,919 | $296,466 | $244,453 |
| 2015 | $6,556 | $532,795 | $292,013 | $240,782 |
| 2014 | $6,465 | $522,359 | $286,293 | $236,066 |
Source: Public Records
Map
Nearby Homes
- 1014 Bancroft Rd
- 1218 Hookston Rd
- 192 Mayhew Way
- 1023 Bermuda Dr
- 54 Village Square Place
- 959 Chandler Ct
- 1013 Mohr Ln Unit 2
- 1049 Mohr Ln Unit A
- 2379 Geraldine Dr Unit 1
- 1674 Kasba St
- 1045 Mohr Ln Unit B
- 1064 Mohr Ln Unit C
- 1044 Mohr Ln Unit D
- 1040 Mohr Ln Unit A
- 1040 Mohr Ln Unit C
- 2117 Gill Port Ln
- 1078 Mohr Ln Unit A
- 1369 Del Rio Cir Unit D
- 1369 Del Rio Cir Unit C
- 2050 Monument Blvd
- 1270 Bermuda Ct
- 985 Bermuda Dr
- 1260 Bermuda Ct
- 1281 Mountbatten Ct
- 986 Bermuda Dr
- 984 Bermuda Dr
- 1281 Bermuda Ct
- 1271 Bermuda Ct
- 1271 Mountbatten Ct
- 1261 Bermuda Ct
- 1310 Baird Ct
- 984 Stimel Dr
- 986 Stimel Dr
- 990 Bermuda Dr
- 1311 Mountbatten Ct
- 988 Stimel Dr
- 1290 Mountbatten Ct
- 1251 Mountbatten Ct
- 1296 Mountbatten Ct
- 1280 Mountbatten Ct
Your Personal Tour Guide
Ask me questions while you tour the home.