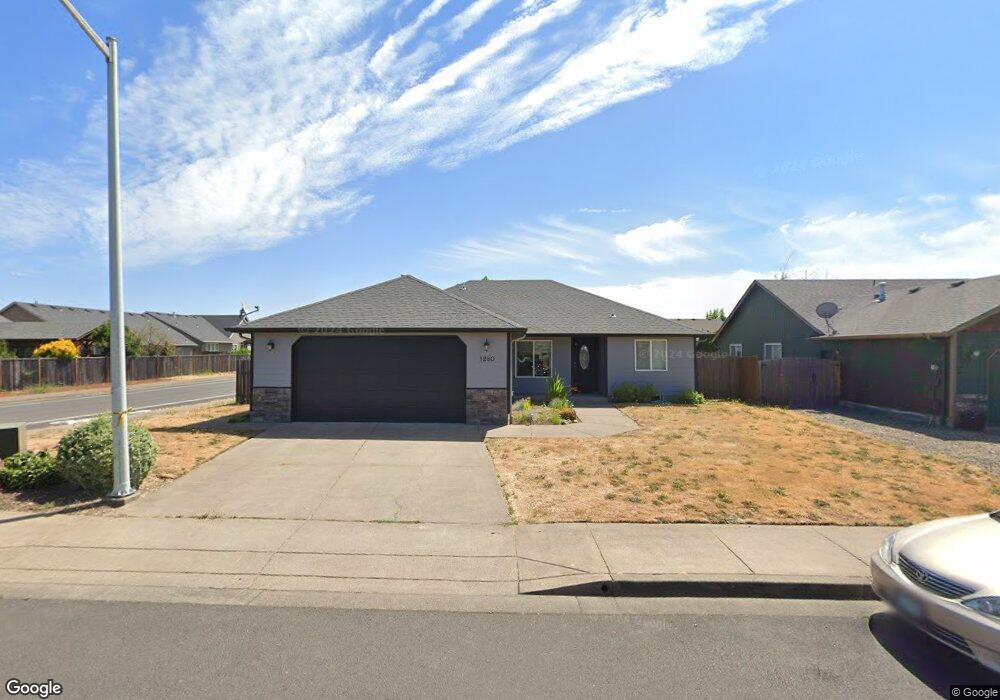
1280 Hazelnut Ct Creswell, OR 97426
Estimated Value: $407,000 - $435,000
3
Beds
2
Baths
1,406
Sq Ft
$303/Sq Ft
Est. Value
About This Home
This home is located at 1280 Hazelnut Ct, Creswell, OR 97426 and is currently estimated at $425,460, approximately $302 per square foot. 1280 Hazelnut Ct is a home located in Lane County with nearby schools including Creslane Elementary School, Creswell Middle School, and Creswell High School.
Ownership History
Date
Name
Owned For
Owner Type
Purchase Details
Closed on
Jan 27, 2015
Sold by
Knopp Theodore F and Knopp Sharon E
Bought by
Knopp Tyler J
Current Estimated Value
Home Financials for this Owner
Home Financials are based on the most recent Mortgage that was taken out on this home.
Original Mortgage
$129,600
Outstanding Balance
$98,646
Interest Rate
3.75%
Mortgage Type
New Conventional
Estimated Equity
$326,814
Purchase Details
Closed on
Nov 14, 2014
Sold by
Hampton Arlis G and Hampton Ryan R
Bought by
Knopp Theodore F and Knopp Sharon E
Purchase Details
Closed on
May 13, 2014
Sold by
Hampton Arlis G and Hampton Ryan R
Bought by
Knopp Theodore F and Knopp Sharon E
Purchase Details
Closed on
Sep 27, 2005
Sold by
Sierra Builders Llc
Bought by
Hampton Arlis G
Home Financials for this Owner
Home Financials are based on the most recent Mortgage that was taken out on this home.
Original Mortgage
$37,350
Interest Rate
5.33%
Mortgage Type
Stand Alone Second
Create a Home Valuation Report for This Property
The Home Valuation Report is an in-depth analysis detailing your home's value as well as a comparison with similar homes in the area
Home Values in the Area
Average Home Value in this Area
Purchase History
| Date | Buyer | Sale Price | Title Company |
|---|---|---|---|
| Knopp Tyler J | $162,000 | Western Title & Escrow Co | |
| Knopp Theodore F | $156,000 | None Available | |
| Knopp Theodore F | $156,000 | None Available | |
| Hampton Arlis G | $186,767 | Evergreen Land Title Co |
Source: Public Records
Mortgage History
| Date | Status | Borrower | Loan Amount |
|---|---|---|---|
| Open | Knopp Tyler J | $129,600 | |
| Previous Owner | Hampton Arlis G | $37,350 | |
| Previous Owner | Hampton Arlis G | $149,400 |
Source: Public Records
Tax History
| Year | Tax Paid | Tax Assessment Tax Assessment Total Assessment is a certain percentage of the fair market value that is determined by local assessors to be the total taxable value of land and additions on the property. | Land | Improvement |
|---|---|---|---|---|
| 2025 | $3,186 | $194,095 | -- | -- |
| 2024 | $2,383 | $188,442 | -- | -- |
| 2023 | $2,383 | $182,954 | $0 | $0 |
| 2022 | $2,566 | $177,626 | $0 | $0 |
| 2021 | $2,479 | $172,453 | $0 | $0 |
| 2020 | $2,445 | $167,431 | $0 | $0 |
| 2019 | $2,391 | $162,555 | $0 | $0 |
| 2018 | $2,357 | $153,224 | $0 | $0 |
| 2017 | $2,287 | $153,224 | $0 | $0 |
| 2016 | $2,342 | $148,761 | $0 | $0 |
| 2015 | $2,257 | $144,428 | $0 | $0 |
| 2014 | $2,239 | $140,221 | $0 | $0 |
Source: Public Records
Map
Nearby Homes
- 332 Owens Way
- 83354 N Pacific Hwy
- 33465 Irish Ln
- 689 Blue Jay Loop
- 156 N 1st St
- 700 N Mill St Unit 112
- 700 N Mill St Unit 1
- 700 N Mill St Unit 107
- 524 N 5th St
- 276 Art Lott Ln
- 460 Meadow Ln
- 395 Ironwood Loop
- 685 St Andrews Loop
- 1137 Ash Grove Loop
- 1237 Spyglass Ct
- 958 Bush Ln
- 375 Sunday Dr
- 272 S 7th St
- 336 Sunday Dr
- 267 Sunday Dr
- 1260 Hazelnut Ct
- 1285 N 1st St
- 1240 Hazelnut Ct
- 1265 N 1st St
- 159 Copper Way
- 181 Copper Way
- 1283 Hazelnut Ct
- 137 Copper Way
- 1253 Hazelnut Ct
- 1245 N 1st St
- 203 Copper Way
- 115 Copper Way
- 1233 Hazelnut Ct
- 225 Copper Way
- 1195 N 1st St
- 1160 Hazelnut Ct
- 1274 Creswood Dr
- 1193 Hazelnut Ct
- 247 Copper Way
- 94 Sandalwood Loop
Your Personal Tour Guide
Ask me questions while you tour the home.