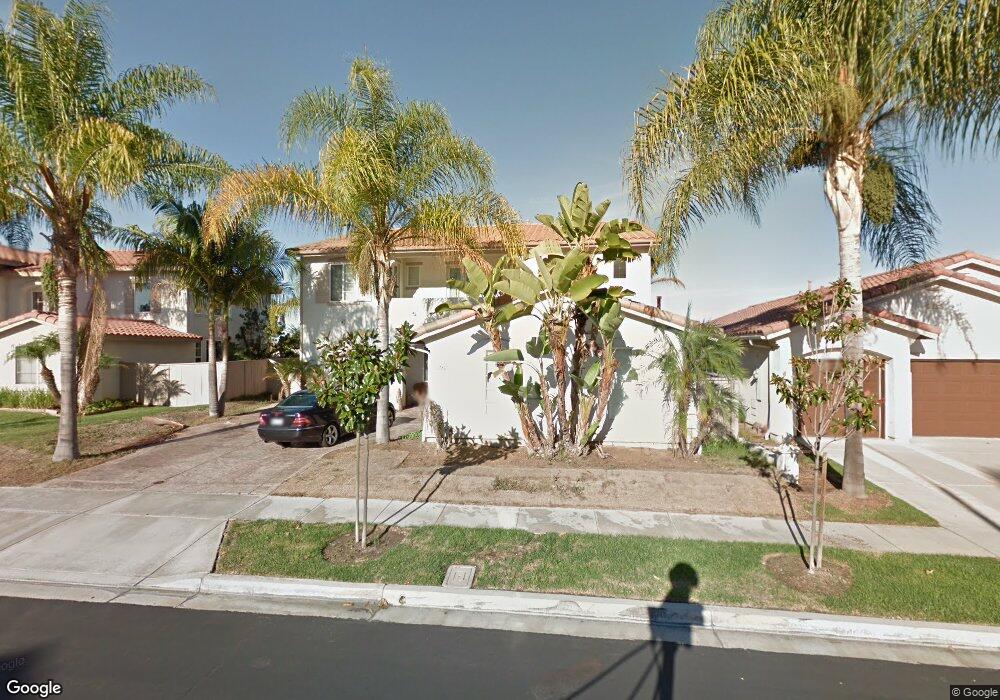
1282 Monte Sereno Ave Chula Vista, CA 91913
Otay Ranch Village NeighborhoodEstimated Value: $1,122,000 - $1,280,000
4
Beds
3
Baths
2,973
Sq Ft
$400/Sq Ft
Est. Value
About This Home
This home is located at 1282 Monte Sereno Ave, Chula Vista, CA 91913 and is currently estimated at $1,190,049, approximately $400 per square foot. 1282 Monte Sereno Ave is a home located in San Diego County with nearby schools including Heritage Elementary School, Rancho Del Rey Middle School, and Otay Ranch Senior High School.
Ownership History
Date
Name
Owned For
Owner Type
Purchase Details
Closed on
Jan 31, 2003
Sold by
Goncalves Fatima R
Bought by
Goncalves Joseph A and Goncalves Fatima R
Current Estimated Value
Purchase Details
Closed on
Nov 23, 2000
Sold by
Shea Homes Ltd Partnership
Bought by
Goncalves Fatima R
Home Financials for this Owner
Home Financials are based on the most recent Mortgage that was taken out on this home.
Original Mortgage
$335,000
Outstanding Balance
$123,265
Interest Rate
7.86%
Estimated Equity
$1,066,784
Purchase Details
Closed on
Nov 22, 2000
Sold by
Goncalves Joseph A
Bought by
Goncalves Fatima R
Home Financials for this Owner
Home Financials are based on the most recent Mortgage that was taken out on this home.
Original Mortgage
$335,000
Outstanding Balance
$123,265
Interest Rate
7.86%
Estimated Equity
$1,066,784
Create a Home Valuation Report for This Property
The Home Valuation Report is an in-depth analysis detailing your home's value as well as a comparison with similar homes in the area
Home Values in the Area
Average Home Value in this Area
Purchase History
| Date | Buyer | Sale Price | Title Company |
|---|---|---|---|
| Goncalves Joseph A | -- | -- | |
| Goncalves Fatima R | $372,500 | First American Title | |
| Goncalves Fatima R | -- | First American Title |
Source: Public Records
Mortgage History
| Date | Status | Borrower | Loan Amount |
|---|---|---|---|
| Open | Goncalves Fatima R | $335,000 |
Source: Public Records
Tax History Compared to Growth
Tax History
| Year | Tax Paid | Tax Assessment Tax Assessment Total Assessment is a certain percentage of the fair market value that is determined by local assessors to be the total taxable value of land and additions on the property. | Land | Improvement |
|---|---|---|---|---|
| 2025 | $10,417 | $560,826 | $150,673 | $410,153 |
| 2024 | $10,417 | $549,830 | $147,719 | $402,111 |
| 2023 | $10,230 | $539,050 | $144,823 | $394,227 |
| 2022 | $9,946 | $528,482 | $141,984 | $386,498 |
| 2021 | $9,744 | $518,120 | $139,200 | $378,920 |
| 2020 | $9,527 | $512,808 | $137,773 | $375,035 |
| 2019 | $9,297 | $502,754 | $135,072 | $367,682 |
| 2018 | $9,130 | $492,897 | $132,424 | $360,473 |
| 2017 | $13 | $483,233 | $129,828 | $353,405 |
| 2016 | $8,633 | $473,759 | $127,283 | $346,476 |
| 2015 | $8,405 | $466,644 | $125,372 | $341,272 |
| 2014 | $8,176 | $457,504 | $122,917 | $334,587 |
Source: Public Records
Map
Nearby Homes
- 1209 Morgan Hill Dr
- 1340 Monte Sereno Ave
- 1284 Saint Helena Ave
- 1402 Antioch Ave
- 1236 El Cortez Ct
- 1181 De Soto Ct Unit 54
- 1377 Stoney Spring Ct
- 1411 Santa Rita E
- 1175 Santa Olivia Rd
- 1236 Bolinas Bay Ct
- 1156 Tristan River Rd
- 1272 Santa Lucia Rd
- 1075 Hayuco Plaza
- 1060 Via Sinuoso
- 1518 Piedmont St
- 1057 Paseo Del Norte
- 1781 Camino Strava Unit 1
- 1711 Avenida Tealing
- 1719 Avenida Tealing Unit 2
- 1631 Applegate St
- 1286 Monte Sereno Ave
- 1278 Monte Sereno Ave
- 1221 Morgan Hill Dr
- 1225 Morgan Hill Dr
- 1290 Monte Sereno Ave
- 1274 Monte Sereno Ave
- 1217 Morgan Hill Dr
- 1229 Morgan Hill Dr
- 1213 Morgan Hill Dr
- 1281 Monte Sereno Ave
- 1233 Morgan Hill Dr
- 1277 Monte Sereno Ave
- 1285 Monte Sereno Ave
- 1270 Monte Sereno Ave
- 1283 Santa Ynez Ave
- 1279 Santa Ynez Ave
- 1273 Monte Sereno Ave
- 1289 Monte Sereno Ave
- 1275 Santa Ynez Ave
- 1266 Monte Sereno Ave