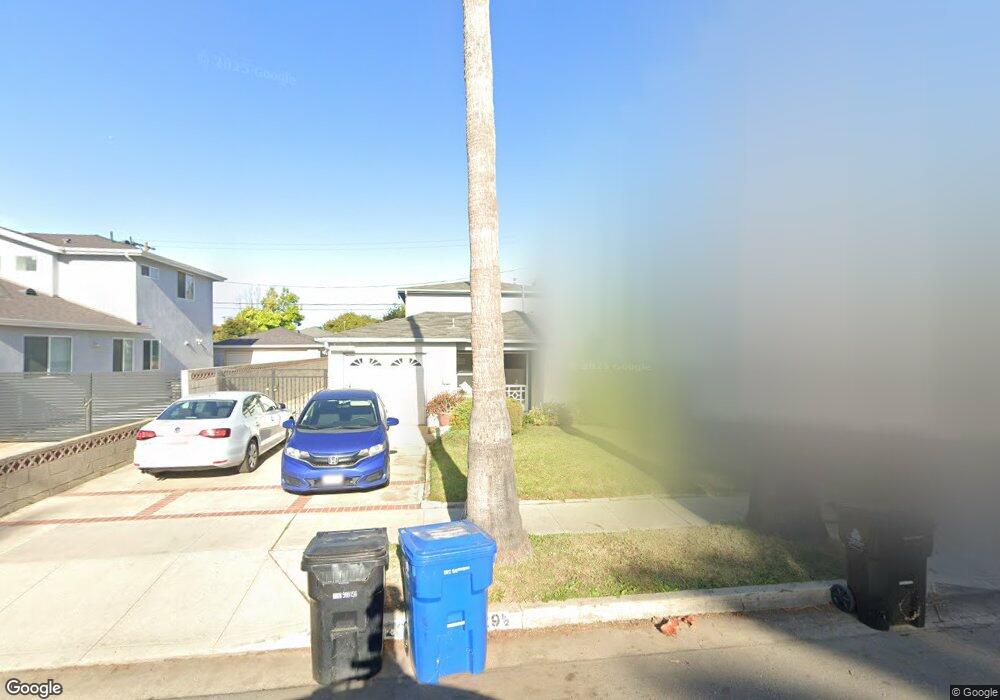
12827 Admiral Ave Los Angeles, CA 90066
Del Rey NeighborhoodEstimated Value: $1,469,000 - $2,673,000
6
Beds
5
Baths
2,850
Sq Ft
$667/Sq Ft
Est. Value
About This Home
This home is located at 12827 Admiral Ave, Los Angeles, CA 90066 and is currently estimated at $1,900,667, approximately $666 per square foot. 12827 Admiral Ave is a home located in Los Angeles County with nearby schools including Short Avenue Elementary School, Marina Del Rey Middle School, and Venice High School.
Ownership History
Date
Name
Owned For
Owner Type
Purchase Details
Closed on
Jul 3, 2017
Sold by
Springer Caroline and Gonzales Survivors Trust
Bought by
Springer Caroline
Current Estimated Value
Purchase Details
Closed on
Feb 6, 2007
Sold by
Gonzales Jimmie G and Gonzales Family Trust
Bought by
Gonzales Jimmie G and Gonzales Survivors Trust
Purchase Details
Closed on
Jul 6, 2001
Sold by
Gonzales Jimmie G and Gonzales Consuelo C
Bought by
Gonzales Jimmie G and Gonzales Consuelo C
Home Financials for this Owner
Home Financials are based on the most recent Mortgage that was taken out on this home.
Original Mortgage
$300,000
Interest Rate
7.26%
Purchase Details
Closed on
Jun 27, 2001
Sold by
Gonzales Jimmie G and Gonzales Consuelo C
Bought by
Gonzales Jimmie G and Gonzales Consuelo C
Home Financials for this Owner
Home Financials are based on the most recent Mortgage that was taken out on this home.
Original Mortgage
$300,000
Interest Rate
7.26%
Create a Home Valuation Report for This Property
The Home Valuation Report is an in-depth analysis detailing your home's value as well as a comparison with similar homes in the area
Home Values in the Area
Average Home Value in this Area
Purchase History
| Date | Buyer | Sale Price | Title Company |
|---|---|---|---|
| Springer Caroline | -- | None Available | |
| Gonzales Jimmie G | -- | None Available | |
| Gonzales Jimmie G | -- | Investors Title | |
| Gonzales Jimmie G | -- | Investors Title Company |
Source: Public Records
Mortgage History
| Date | Status | Borrower | Loan Amount |
|---|---|---|---|
| Previous Owner | Gonzales Jimmie G | $300,000 |
Source: Public Records
Tax History Compared to Growth
Tax History
| Year | Tax Paid | Tax Assessment Tax Assessment Total Assessment is a certain percentage of the fair market value that is determined by local assessors to be the total taxable value of land and additions on the property. | Land | Improvement |
|---|---|---|---|---|
| 2025 | $4,834 | $375,402 | $112,672 | $262,730 |
| 2024 | $4,834 | $368,042 | $110,463 | $257,579 |
| 2023 | $4,750 | $360,827 | $108,298 | $252,529 |
| 2022 | $4,543 | $353,753 | $106,175 | $247,578 |
| 2021 | $4,472 | $346,818 | $104,094 | $242,724 |
| 2020 | $4,512 | $343,263 | $103,027 | $240,236 |
| 2019 | $4,344 | $336,533 | $101,007 | $235,526 |
| 2018 | $4,239 | $329,935 | $99,027 | $230,908 |
| 2016 | $4,030 | $317,126 | $95,183 | $221,943 |
| 2015 | $3,974 | $312,364 | $93,754 | $218,610 |
| 2014 | $4,007 | $306,246 | $91,918 | $214,328 |
Source: Public Records
Map
Nearby Homes
- 12871 Rubens Ave
- 12870 Walsh Ave
- 12926 Bonaparte Ave
- 12836 Gilmore Ave
- 12961 Panama St
- 12939 Greene Ave
- 12930 Gilmore Ave
- 12531 Culver Blvd
- 4373 Mcconnell Blvd
- 13044 Mindanao Way Unit 2
- 12479 Walsh Ave
- 4336 Alla Rd
- 13078 Mindanao Way Unit 314
- 12445 Greene Ave
- 13065 Mindanao Way Unit 3
- 13010 Maxella Ave Unit 5
- 4780 La Villa Marina Unit H
- 4260 Mcconnell Blvd
- 4250 Mcconnell Blvd
- 4220 Kenyon Ave
- 12821 Admiral Ave
- 12831 Admiral Ave
- 12837 Admiral Ave
- 12817 Admiral Ave
- 12826 Bonaparte Ave
- 12830 Bonaparte Ave
- 12820 Bonaparte Ave
- 12811 Admiral Ave
- 12841 Admiral Ave
- 12836 Bonaparte Ave
- 12816 Bonaparte Ave
- 12826 Admiral Ave
- 12820 Admiral Ave
- 12830 Admiral Ave
- 12840 Bonaparte Ave
- 12810 Bonaparte Ave
- 12816 Admiral Ave
- 12836 Admiral Ave
- 12847 Admiral Ave
- 12807 Admiral Ave