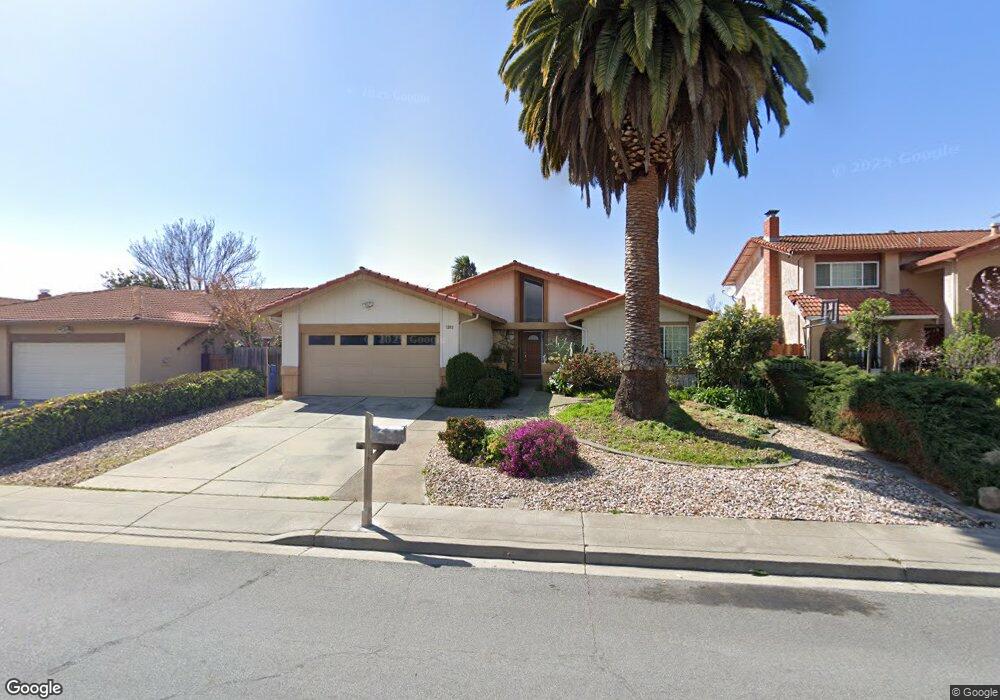
1283 Fontainbleu Ave Milpitas, CA 95035
Estimated Value: $1,675,000 - $2,062,000
3
Beds
2
Baths
1,644
Sq Ft
$1,124/Sq Ft
Est. Value
About This Home
This home is located at 1283 Fontainbleu Ave, Milpitas, CA 95035 and is currently estimated at $1,847,903, approximately $1,124 per square foot. 1283 Fontainbleu Ave is a home located in Santa Clara County with nearby schools including Marshall Pomeroy Elementary School, Thomas Russell Middle School, and Milpitas High School.
Ownership History
Date
Name
Owned For
Owner Type
Purchase Details
Closed on
Oct 24, 2008
Sold by
Liu Alex Chun Fu and Shih Yi Fen
Bought by
Chiu Tony Tung Chien
Current Estimated Value
Home Financials for this Owner
Home Financials are based on the most recent Mortgage that was taken out on this home.
Original Mortgage
$417,000
Outstanding Balance
$268,358
Interest Rate
5.77%
Mortgage Type
Purchase Money Mortgage
Estimated Equity
$1,579,545
Purchase Details
Closed on
Mar 26, 1999
Sold by
Kamran Sarmadi and Mosallaie Maryam
Bought by
Liu Alex Chun Fu and Shih Yi Fen
Home Financials for this Owner
Home Financials are based on the most recent Mortgage that was taken out on this home.
Original Mortgage
$240,000
Interest Rate
6.79%
Create a Home Valuation Report for This Property
The Home Valuation Report is an in-depth analysis detailing your home's value as well as a comparison with similar homes in the area
Home Values in the Area
Average Home Value in this Area
Purchase History
| Date | Buyer | Sale Price | Title Company |
|---|---|---|---|
| Chiu Tony Tung Chien | $668,000 | First American Title Company | |
| Liu Alex Chun Fu | $377,500 | Old Republic Title Company |
Source: Public Records
Mortgage History
| Date | Status | Borrower | Loan Amount |
|---|---|---|---|
| Open | Chiu Tony Tung Chien | $417,000 | |
| Previous Owner | Liu Alex Chun Fu | $240,000 |
Source: Public Records
Tax History Compared to Growth
Tax History
| Year | Tax Paid | Tax Assessment Tax Assessment Total Assessment is a certain percentage of the fair market value that is determined by local assessors to be the total taxable value of land and additions on the property. | Land | Improvement |
|---|---|---|---|---|
| 2025 | $9,828 | $860,214 | $430,107 | $430,107 |
| 2024 | $9,828 | $843,348 | $421,674 | $421,674 |
| 2023 | $9,796 | $826,812 | $413,406 | $413,406 |
| 2022 | $9,755 | $810,600 | $405,300 | $405,300 |
| 2021 | $9,612 | $794,706 | $397,353 | $397,353 |
| 2020 | $9,444 | $786,558 | $393,279 | $393,279 |
| 2019 | $9,336 | $771,136 | $385,568 | $385,568 |
| 2018 | $8,864 | $756,016 | $378,008 | $378,008 |
| 2017 | $8,749 | $741,194 | $370,597 | $370,597 |
| 2016 | $8,395 | $726,662 | $363,331 | $363,331 |
| 2015 | $8,309 | $715,748 | $357,874 | $357,874 |
| 2014 | $8,086 | $701,728 | $350,864 | $350,864 |
Source: Public Records
Map
Nearby Homes
- 182 Rose Dr
- 99 Jacklin Ct
- 392 Terra Mesa Way
- 1200 N Abbott Ave Unit 200
- 1206 California Cir
- 1830 Vegas Ave
- 1377 California Cir
- 1375 California Cir
- 773 Heflin St
- 1361 Lilac Way
- 1355 Lilac Way
- 1000 Jacklin Rd
- 207 Redwood Ave
- 1610 Hidden Creek Ln
- 1048 N Abbott Ave
- 60 Wilson Way Unit 171
- 60 Wilson Way Unit 150
- 60 Wilson Way Unit 158
- 1087 N Abbott Ave
- 468 Glenmoor Cir
- 1295 Fontainbleu Ave
- 1271 Fontainbleu Ave
- 1288 Belbrook Way
- 1300 Belbrook Way
- 1269 Fontainbleu Ave
- 1311 Fontainbleu Ave
- 1276 Belbrook Way
- 108 Fontainbleu Ct
- 1312 Belbrook Way
- 109 Beaumere Way
- 1264 Belbrook Way
- 1257 Fontainbleu Ave
- 120 Fontainbleu Ct
- 1308 Fontainbleu Ave
- 84 Vienna Dr
- 96 Vienna Dr
- 1252 Belbrook Way
- 121 Beaumere Way
- 62 Vienna Dr
- 1245 Fontainbleu Ave